


( 1817 Students )


Career Path - Data Strategist
Unlock the power of Data for strategic decision-making & business success. Deep-dive into data collection, analysis, interpretation, and visualizationPreview Career Path - Data Strategist course
Price Match Guarantee Full Lifetime Access Access on any Device Technical Support Secure Checkout Course Completion Certificate 95% Started a new career
BUY THIS COURSE (
95% Started a new career
BUY THIS COURSE (GBP 32 GBP 99 )-
 88% Got a pay increase and promotion
Students also bought -
-
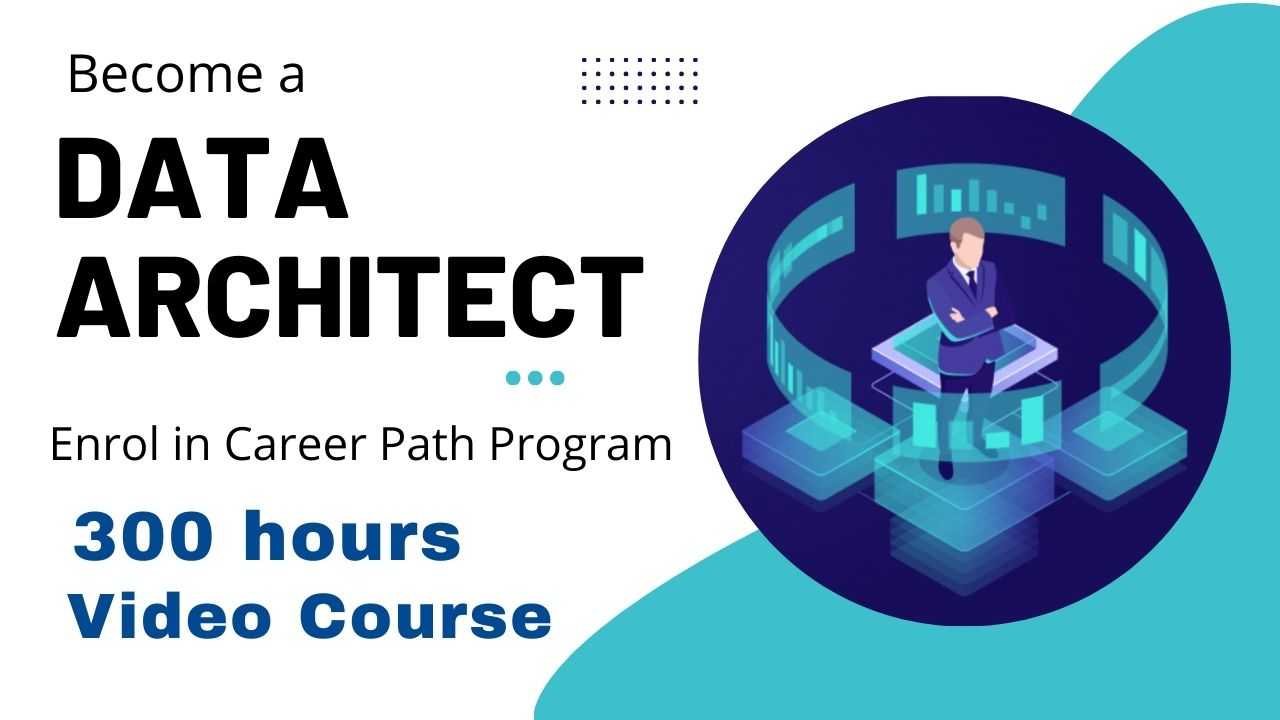
- Career Path - Data Architect
- 300 Hours
- GBP 32
- 3310 Learners
-
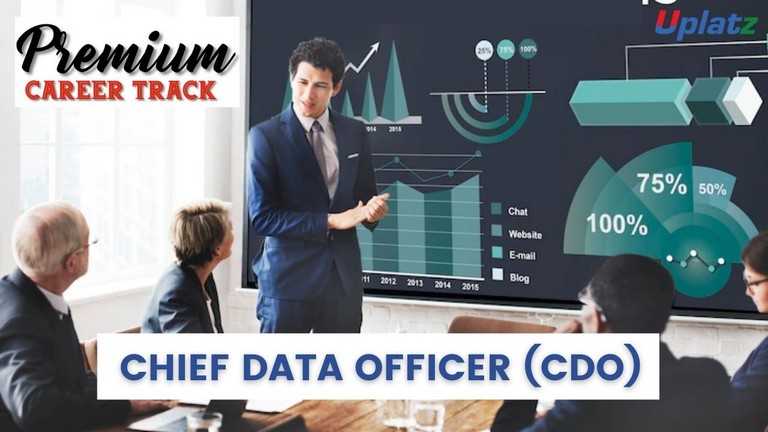
- Premium Career Track - Chief Data Officer (CDO)
- 600 Hours
- GBP 41
- 4405 Learners
-

- Career Path - Data Consultant
- 500 Hours
- GBP 32
- 1383 Learners

Courses included in the Data Strategist Career Path program by Uplatz are:
1.Business Intelligence and Data Analytics
2.Data Science with Python
3.Data Science with R
4.Data Visualization with Python
5.Data Visualization with R
6.Machine Learning
7.SAP BPC (Business Planning and Consolidation)
8.SAP MDG (Master Data Governance)
9.Cloud Computing Fundamentals
10.SQL Programming
A data strategist is a professional who combines expertise in data analysis, business strategy, and technology to develop and execute data-driven strategies that align with an organization's goals and objectives. Their primary role is to leverage data as a strategic asset to drive decision-making, operational efficiency, and business growth.
Roles and responsibilities of a data strategist include:
1.Strategic Planning: Developing a data strategy that aligns with the organization's overall business goals and objectives.
2.Data Governance: Establishing data governance frameworks, policies, and standards to ensure data quality, security, and compliance.
3.Data Analysis: Utilizing advanced analytical techniques to uncover insights and trends within large datasets, helping to inform strategic decisions.
4.Business Intelligence: Designing and implementing business intelligence solutions to provide stakeholders with timely and actionable insights.
5.Predictive Modeling: Building predictive models and utilizing machine learning algorithms to forecast future trends and outcomes.
6.Data Infrastructure: Collaborating with IT teams to design and maintain scalable data infrastructure, including data warehouses and data lakes.
7.Stakeholder Collaboration: Working closely with various departments and stakeholders to understand their data needs and provide solutions that support their objectives.
8.Performance Metrics: Defining key performance indicators (KPIs) and metrics to measure the effectiveness of data-driven strategies.
9.Innovation: Identifying emerging technologies and trends in data analysis and recommending their application to improve business processes.
10.Change Management: Guiding the organization through cultural shifts towards a more data-driven decision-making approach.
11.Ethical Considerations: Ensuring that data collection, analysis, and usage align with ethical and legal standards, respecting user privacy and data security.
12.Continuous Improvement: Regularly evaluating the effectiveness of data strategies and making adjustments based on feedback and outcomes.
13.Communication: Effectively communicating complex data concepts and insights to non-technical stakeholders.
14.Training and Education: Providing training and education to team members and colleagues on data-related concepts and tools.
15.Risk Management: Identifying potential risks associated with data strategy implementation and developing mitigation plans.
In essence, a data strategist plays a pivotal role in bridging the gap between data analysis and business strategy, helping organizations make informed decisions, optimize operations, and gain a competitive edge in today's data-driven landscape.
Data strategists need the technical skills to understand data. It isn’t necessarily about coding lots of Python every day or discussing the minutiae of a particular regression technique. Instead, it’s more about having the intuition to know which datasets are likely to be valuable for the firm’s trading style and to leave those which are likely irrelevant. Data strategists also need excellent soft skills, given that a data strategist acts as a bridge between the outside firms and internal clients such as data scientists and portfolio managers.
Course/Topic 1 - Business Intelligence and Data Analytics - all lectures
-
In this lecture session we discuss about Bi concepts, examples and application of business intelligence and data analytics and also cover other concepts of BI.
-
In this lecture session we learn about basic concepts of BI and also cover factors of business intelligence in brief.
-
In this lecture session we learn about data warehouse data access and data dashboarding and also cover presentation in BI.
-
In this lecture session we learn about product database, advertise database and customer demographic database and also cover data analyst concepts.
-
In this lecture session we learn about basic introduction of business intelligence and also cover factors of business intelligence in brief.
-
In this lecture session we learn about introduction of predictive modeling and also cover functions of predictive modeling in brief.
-
In this lecture session we learn about data related to customer services and also talk about customer relation databases in brief.
-
In this lecture session we learn about introduction of NoSQL and also cover basic functions of NoSQL in business intelligence.
-
In this lecture session we learn about graph stores and also talk about the advantages and disadvantages of graph stores in BI.
-
In this lecture session we learn about hierarchical clustering in business intelligence and also talk about clustering factors in BI.
-
In this lecture session we learn about introduction of salesforce in business intelligence and also talk about some basic uses of salesforce.
-
In this lecture session we learn about introduction to NLP and also cover what is natural language processing in artificial intelligence.
-
In this lecture session we learn about natural language processing speech to text conversion and also cover the importance of natural language processing.
-
In this lecture session we learn about introduction of apache server in business intelligence and also talk about basics of apache server.
-
In this lecture session we learn about deep drive into business intelligence and also talk about factors or deep drive in business intelligence.
-
In this lecture session we learn about data warehousing in business intelligence and data analytics and also talk about factors and features of data warehousing.
-
In this lecture session we learn about types of data in business intelligence and also talk about different types of data in BI.
-
In this lecture session we learn about mobile BI and also talk about open source BI software replacing vendor offering.
-
In this lecture session we learn about real time BI in business intelligence and also talk about factors of real time BI in brief.
-
In this lecture session we learn about data analytics comprehensively and also talk about functions of data analytics.
-
In this lecture session we talk about data analytics vs business analytics and also talk about the importance of data analytics.
-
In this lecture session we learn about Embedded analytics and also talk about functions of Embedded analytics in data analytics.
-
In this lecture session we learn about collection analytics and also cover the importance of collection analytics.
-
In this lecture session we learn about survival analytics and also cover duration analytics in brief.
-
In this lecture session we learn about machine learning techniques and also cover the importance and factors of machine learning techniques in business intelligence.
-
In this lecture session we learn about geospatial predictive analytics and also talk about functions of geospatial predictive analytics in business intelligence.
-
In this lecture session we learn about cohort analysis in data analyst and we also cover functions and importance of cohort analysis.
-
In this lecture session we learn about data mining in business intelligence and also talk about data mining functions and why we need data mining in business intelligence.
-
In these lecture sessions we learn about anomaly detection and also talk about functions of anomaly detection in brief.
-
In these lecture sessions we learn about statistically sound association and also talk about factors of statistically sound association in business intelligence.
-
In this lecture session we learn about cluster analysis. We’ll cover all types of cluster analysis in brief and also cover the importance of cluster analysis in business analysis.
-
In this lecture session we learn about DBSCAN in business intelligence and also talk about DBSCAN functions and importance.
-
In this lecture session we learn about regression models in business intelligence and also talk about the function of regression models.
-
In this lecture session we learn about extraction based summarization in business intelligence and also cover all types of summarization in data analyst.
-
In this lecture session we learn about machine learning in BI and also talk about factors and importance of machine learning in brief.
-
In this lecture session we learn about machine learning vs BI we also discuss the basic difference between machine learning and business intelligence.
-
In this lecture session we learn about how ml can make BI better and also talk about ml basic functions.
-
In this lecture session we learn about data warehousing and also talk about how we manage data warehousing in business intelligence.
-
In this lecture session we learn about data warehousing in business intelligence and data analytics and also talk about factors and features of data warehousing.
-
In this lecture session we learn about data mart in business intelligence and also talk about data mart function.
-
In this lecture session we learn about data dimensions in business intelligence and also cover all types of data dimension in BI.
-
In this lecture session we learn about data dimension in business intelligence and also cover functions and importance of data dimension.
-
In this lecture session we learn about data vault modeling in business intelligence and also cover different types of vault modeling in brief.
-
In this lecture session we learn about links and satellites and also cover the importance and factors of links and satellites in business intelligence.
Course/Topic 2 - Data Science with Python - all lectures
-
In this video tutorial we will get introduced to Data Science and the integration of Python in Data Science. Furthermore, we will look into the importance of Data Science and its demand and the application of Data Science.
-
In this video we will learn, all the concepts of Python programming related to Data Science. We will also learn about the Introduction to Python Programing, what is Python Programming and its History, Features and Application of Python along with its setup. Further we will see how to get started with the first python program.
-
This video talks about the Variable and Data Types in Python Programming. In this session we will learn What is variable, the declaration of variable and variable assignment. Further we will see the data types in python, checking data types and data type conversions.
-
This tutorial will help you to understand Data Types in python in depth. This video talks about the data types such as numbers, sequence type, Boolean, set and dictionary.
-
This tutorial talks about the Identifier, keyword, reading input and output formatting in Data Science. We will learn about what is an identifier and keywords. Further we will learn about reading input and taking multiple inputs from a user, Output formatting and Python end parameter.
-
This tutorial talks about taking multiple inputs from user and output formatting using format method, string method and module operator.
-
This tutorial talks about the Operators and type of operators. In this session we will learn about the types of operators such as arithmetic, Relational and Assignment Operators.
-
This tutorial talks further about the part 2 of operators and its types. In this session we will learn about the types of operators such as Logical, Membership, Identity and Bitwise Operators.
-
In this video you will learn about the process of decision making in Data Science. Furthermore, this tutorial talks about different types of decision-making statements and its application in Data Science.
-
In this video tutorial we will learn about the Loops in Python programing. We will cover further the different types of Loops in Python, starting with: For Loop.
-
In this session we will cover the further part of loops in Python programming. The type of loops explained in this video is: While loop and nested loop.
-
In this session we will cover the further part of loops in Python programming. The type of loops explained in this video is: break, continue and pass loops
-
In this video tutorial we will start explaining about the lists in Python Programming. This tutorial talks about accessing values in the list and updating the list in Data Science.
-
In this video tutorial we will look into the further parts about the lists in Python Programming. Deleting list elements, basic list operations, built in functions and methods and the features which are covered in this session.
-
This tutorial will cover the basics on Tuples and Dictionary function in Data Science. We will learn about accessing and deleting tuple elements. Further we will also cover the basic tuples operations and the built in tuple functions and its methods. At the end we will see the differences in list and tuple.
-
This tutorial will cover the advanced topics on Tuples and Dictionary function in Data Science. Further in this session we will learn about the Python Dictionary, how to access, update and delete dictionary elements. Lastly we will cover built in functions and methods.
-
In this session we will learn about the functions and modules used in Data science. After watching this video, you will be able to understand what is a function, the definition of function and calling a function.
-
In this session we will learn about the further functions and modules used in Data science. After watching this video, you will be able to understand the ways to write a function, Types of functions, Anonymous Functions and Recursive functions.
-
In this session we will learn about the advanced functions and modules used in Data science. After watching this video, you will be able to understand what is a module, creating a module, import statement and locating modules.
-
This tutorial talks about the features of working with files. In this video we will learn about opening and closing file, the open function, the file object Attributes, the close method, reading and writing files.
-
This tutorial talks about the advanced features of working with files. In this video we will learn about file positions, renaming and deleting files.
-
In this session we will learn about the regular expression. After this video you will be able to understand what is a regular expression, meta characters, match function, search function, Re- match vs research, split function and sub function.
-
This video introduces you to the Data Science Libraries. In this video you will learn about the Data science libraries: libraries for data processing, modelling and data visualization.
-
In this session we will teach about the components of python ecosystem in Data Science. This video talks about the Components of Python Ecosystem using package Python distribution Anaconda and jupyter notebook.
-
This tutorial talks about the basics of analyzing data using numpy and pandas. The Pandas module mainly works with the tabular data, whereas the NumPy module works with the numerical data. We will further see what is Numpy and why we use numpy.
-
This tutorial talks about the later part of analyzing data using numpy and pandas. In this tutorial we will learn how to install numpy.
-
This tutorial talks about the advanced part of analyzing data using numpy and pandas. In this session we will learn what is Pandas and the key features of Pandas. We will also learn about the Python Pandas environment setup.
-
This tutorial talks about the advanced part of analyzing data using numpy and pandas. In this session we will learn about Pandas data structure with example.
-
This the last session on Analysing Data using Numpy and Pandas. In this session we will learn data analysis using Pandas
-
In this video tutorial we will learn about the Data Visualization using Matpotlib. This video talks about what is data visualisation, introduction to matplotlib and installation of matplotlib.
-
In this session we will see the part 2 of Data Visualization with Matplotlib. This video talks about the types of data visualization charts and line chart scatter plot
-
This tutorial covers part 3 of Data Visualization with Matplotlib. This session covers the types of data visualisation charts: bar chart histogram, area plot pie chart and box plot contour plot.
-
This session talks about the Three-Dimensional Plotting with Matplotlib . In this we will learn about plot 3D scatter, plot 3D contour and plot 3D surface plot.
-
In this tutorial we will cover basics of Data Visualisation with Seaborn. Further we will cover Introduction to seaborn, seaborn functionalities, how to install seaborn and the different categories of plot in seaborn
-
In this tutorial we will cover the advanced topics of Data Visualisation with Seaborn. In this video we will see about exploring seaborn plots.
-
Introduction to Statistical Analysis is taught in this video. We will learn what is statistical analysis and introduction to math and statistics for data science. Further we will learn about the terminologies in statistics for data science and categories in statistics, its correlation and lastly mean median and mode quartile.
-
This video course talks about the basics of Data Science methodology. We will learn how to reach from problem to approach.
-
In this session we will see Data Science Methodology from requirements to collection and from understanding to preparation.
-
In this session we will learn advanced Data Science Methodology from modelling to evaluation and from deployment to feedback.
-
This video tutorial talks about the - Introduction to Machine Learning and its Types. In this session we will learn what is machine learning and the need for machine learning. Further we will see the application of machine learning and different types of machine learning. We will also cover topics such as supervised learning, unsupervised learning and reinforcement learning.
-
This video tutorial talks about the basics of regression analysis. We will cover in this video linear regression and implementing linear regression.
-
This video tutorial talks about the further topics of regression analysis. In this video we will learn about multiple linear regression and implementing multiple linear regression.
-
This video tutorial talks about the advanced topics of regression analysis. In this video we will learn about polynomial regression and implementing polynomial regression.
-
In this session we will learn about the classification in Data science. We will see what is classification, classification algorithms and Logistic regression. Also we will learn about implementing Logistic regression.
-
In this session we will learn about the further topics of classification in Data science, such as decision tree and implementing decision tree.
-
In this session we will learn about the advanced topics of classification in Data science, such as support vendor machine and implementing support vector machine.
-
This tutorial will teach you about what is clustering and clustering algorithms. Further we will learn what K means clustering and how does K means clustering work and also about implementing K means clustering.
-
In this session we will see the further topics of clustering, such as hierarchical clustering, agglomerative hierarchical clustering, how does agglomerative hierarchical clustering Work and divisive hierarchical clustering.
-
This video tutorial talks about the advanced topics of clustering, such as implementation of agglomerative hierarchical clustering.
-
This video will help you to understand basics of Association rule learning. In this session we will learn about the Apriori algorithm and the working of Apriori algorithm.
-
This video will help you to understand advanced topics of Association rule learning such as implementation of Apriori algorithm.
-
This is a session on the practical part of Data Science application. In this example we will see problem statement, data set, exploratory data analysis.
-
This is a session on the practical part of Data Science application.
-
This is a session on the practical part of Data Science application. In this we will see the implementation of the project.
-
This is a session on the practical part of Data Science application
-
This is a session on the practical part of Data Science application
Course/Topic 3 - Data Science with R - all lectures
-
In this lecture session we learn about introduction of data science and also talk about features of data science in R.
-
In this lecture session we learn about data collection and management and also talk about features of data collection and management in data science with R.
-
In this lecture session we learn about model deployment and maintenance and also talk about functions of model deployment and maintenance in data science with R.
-
In this lecture session we learn about setting expectations and also talk about factors of setting expectations in brief.
-
In this lecture session we learn about loading data into R and also talk about features of loading data into R and also talk about the importance of loading data into R.
-
In this lecture session we learn about exploring data in data science and machine learning and also talk about features of exploring data in data science and machine learning.
-
In this lecture session we learn about features of exploring data using R and also talk about factors of exploring data using R.
-
In this lecture session we learn about benefits of data cleaning and also talk about features of benefits of data cleaning.
-
In this lecture session we learn about cross validation in R and also talk about features of validation in data science with R.
-
In these lecture sessions we learn about data transformation in data science with R and also talk about features of data transformation in brief.
-
In this lecture session we learn about modeling methods in data science with R and also talk about the importance of modeling methods.
-
In this lecture session we learn about solving classification problems and also talk about features of solving classification problems in brief.
-
In this lecture session we learn about working without known targets in data science with r and also talk about features of working without known targets.
-
In this lecture session we learn about evaluating models in data science with R and also talk about features of evaluating models in brief.
-
In this lecture session we learn about confusion matrix in indian accounting standards and also talk about features of confusion matrix.
-
In this lecture session we learn about introduction to linear regression and also talk about features of linear regression in indian accounting standards.
-
In this lecture session we learn about linear regression in R and also talk about features and functions of linear regression in brief.
-
In this lecture session we learn about linear regression in R in data science with r and also talk about features of linear regression in R language.
-
In this lecture session we learn about simple and multiple regression in data science with r and also talk about the basic difference between simple and multiple regression in brief.
-
In this lecture session we learn about linear and logistic regression in data science with r language and also talk about functions of linear and logistics regressions.
-
In this lecture session we learn about support vector machines (SVM) in R and also talk about features of support vector machines in data science with R language.
-
In this lecture session we learn about factors of support vectors machines in data science with R and also talk about features of support vectors machines.
-
In this lecture session we learn about unsupervised methods in data science with R and also talk about functions of unsupervised methods in data science.
-
In this lecture session we learn about clustering in data science with R language and also talk about features of clustering in data science.
-
In this lecture session we learn about K-means algorithms in R and also talk about all types of algorithms in data science with R language.
-
In this lecture session we learn about hierarchical clustering in data science with R language and also talk about features of hierarchical clustering.
-
In this lecture session we learn about libraries in data science with R and also talk about libraries of hierarchical clustering in brief.
-
In this lecture session we learn about the dendrogram of diana and also talk about all types of clustering in data science with R.
-
In this lecture session we learn about market basket analysis in data science with R and also talk about features of market basket analysis in data science with R.
-
In this lecture session we learn about MBA and association rule mining in data science with r language.
-
In this lecture session we learn about implementing MBA in data science with R and also talk about implementing MBA.
-
In this lecture session we learn about association rule learning in data science with R and also talk about features of association rule learning.
-
In this lecture session we learn about decision tree algorithms in data science with R and also talk about features of tree algorithms.
-
In this lecture session we learn about exploring advanced methods in tree algorithms in data science with R and also talk about features of exploring advanced methods.
-
In this lecture session we learn about using kernel methods and also talk about features of using kernel methods in data science with R.
-
In this lecture session we learn about documentation and deployment and also talk about features of documentation and deployment in data science with R.
Course/Topic 4 - Data Visualization in Python - all lectures
-
In this first video tutorial on Data Visualization in Python course, you will get a brief introduction and overview on what is data visualization, its importance, benefits and the top python libraries for Data Visualization like Matplotlib, Plotly and Seaborn.
-
In this first part of the video on Matplotlib, you will learn both the theoretical and the practical knowledge on Matplotlib, which is one of the most popular and top python libraries for Data Visualization. You will get a complete introduction to Matplotlib, the installation of Matplotlib with pip, the basic plotting with Matplotlib and the Plotting of two or more lines in the same plot.
-
In this second part of the Matplotlib video tutorial, you will learn how to add labels and titles like plt.xlabel and plt.ylabel along with understanding how to create lists and insert functions onto it. All this can be seen explained it detail by the instructor by taking examples for it.
-
In this tutorial, you will learn about 2 important python libraries namely; Numpy and Pandas. Along with the theoretical concepts, you will also get practical implementation on various topics related to these two such as what is Numpy and what is its use, the installation of Numpy along with example, what is pandas and its key features, with the installation of Python Pandas and finally the Data Structure with examples of Pandas.
-
In this second part of the Numpy and Pandas tutorial, you will learn the complete overview of Pandas like its history, its key features, the installation process of Pandas, Pandas Data Structure and within it the Data Frame and syntax to create Data Frame. All this will be explained in detail by the instructor.
-
In this third part of the video tutorial on Numpy and Pandas, you will learn about creating Data Frame from Dictionary. Also, you will understand how to read CSV Files with Pandas using practical examples by the Instructor.
-
In this tutorial, you will learn about the different Data Visualization Tools such as Bar Chart, Histogram and the Pie Chart. You will get a complete understanding of what is these tools, why and how to use these 3 tools, the syntax for creating Bar Chart, Histogram and the Pie Chart and different programs for creating these data visualization tools. In the first part of the video, you will learn about the Bar Chart and in the subsequent videos, you will learn about the Histogram and the Pie Chart.
-
In this second part of the Data Visualization Tools video, you will learn about the complete overview of Histogram like what is Histogram, how to create Histogram and many others with the help of practical examples by the instructor.
-
In this third and final part of the Data Visualization Tools video, you will learn about the Pie Chart-what is Pie Chart, how to create the Pie Chart and how to create the syntax for Pie Chart? All these questions will be explained in detail by the instructor by taking practical examples. Further, you will understand the concept of Autoptic parameter in Pie Chart.
-
In this first part of the video tutorial on more data visualization tools, you will learn about some additional data visualization tools apart from Bar Chart, Histogram and Pie Chart such as Scatter Plot, Area Plot, STACKED Area Plot and the Box Plot. The first part of this tutorial consists of mainly the Scatter Plot, the theoretical concepts associated with it such as what is Scatter Plot, the syntax for creating Scatter Plot and creating Scatter Plot with examples.
-
In this second part of the video tutorial, you will learn and understand what is Area Plot, creating Area Plot with Function and Syntax and creating Area Plot with examples. All these will be seen explained in detail by the instructor. Further, you will also learn and understand the concept associated with the STACKED Area Plot.
-
In this final part of the video tutorial, you will learn about the Box Plot; which is also known as Whisker Plot, how to create Box Plot, its syntax and arguments used like Data & Notch, the parameters used in Box Plot such as vert, patch artist and widths. These will be seen explained in detail by the instructor.
-
In this first video tutorial on Advanced Data Visualization Tools, you will learn about the Waffle Chart – its definition, complete overview, the syntax and programs to create Waffle Chart and the step-by-step procedure to create the Waffle Chart. All these will be seen explained in detail by the instructor.
-
In this second part of the video tutorial on Advanced Data Visualization Tools, you will learn about the Word Cloud-its definition, the reason why Word Cloud is used, what are the modules needed in generating the Word Cloud in Python, how to install Word Cloud and how to create Word Cloud with the help of some examples.
-
In this tutorial, you will learn and understand about the concept of Heat Map and how one can create the Heat Map along with the help of the parameter camps. This will be seen explained in detail by the instructor.
-
In this first part of the video tutorial on Specialized Data Visualization Tools, you will learn about the Bubble Chart; its definition and how to create bubble charts with the help of different examples.
-
In this video, you will learn about the Contour Plots; which is also sometimes referred to as Level Plots. Along with understanding the whole theoretical concept of Contour Plots, you will also learn how to create Contour Plots with practical examples as will be seen explaining by the instructor in details.
-
In this third part of the video on Specialized Data Visualization Tools, you will learn about the Quiver Plot and how to create the Quiver Plot by taking different examples. This will be seen explained in complete details by the instructor.
-
In this video on Specialized Data Visualization Tools, you will learn about 3D plotting in Matplotlib and also the 3D Line Plot used in Data Visualization with the help of different practical examples and how to create it. This will be seen explained in detailed by the instructor throughout the tutorial.
-
In this tutorial, you will learn about the 3D Scatter Plot and how to create a 3D Scatter Plot. The instructor will be seen explaining this in complete details with the help of different examples.
-
In this tutorial, you will learn and understand the 3D Contour Plot, what is the function used in creating the 3D Contour Plot and how it can be created; which will be explained in detail by the instructor with the help of examples.
-
In this last part of the video tutorial on Specialized Data Visualization Tools, you will learn about the 3D Wireframe Plot and the 3D Surface Plot, along with creating the same with the help of different examples, seen explained in detail by the instructor.
-
In this tutorial, you will learn about Seaborn, which is another very important Python library. Through this video, you will get an introduction to Seaborn, along with some important features of it, functionalities of Seaborn, Installation of Seaborn, the different categories of plot in Seaborn and some basic type of plots one can create using Seaborn like Distribution Plot.
-
In this second part of the video on Seaborn Library, you will learn and understand some basic plots using Seaborn Library like the Line Plot. Here, the instructor will be seen explaining in detail the Seaborn Line Plot and with a detailed example of how to create Seaborn Line Plot with random data.
-
This is a continuation video of creating the Line Plot with some more examples using the Seaborn library. Along with this, you will also learn about the Lmplot and the function used for creating the Lmport. This can be seen explained in detailed by the instructor with practical examples.
-
In this tutorial, you will learn about Data Visualization using Seaborn library. Under this, you will learn the Strip Plot, how to create the strip plot and the program used to create the Strip Plot. This will be shown by the Instructor with detailed examples like Strip plot using inbuilt data-set given in Seaborn and others.
-
In this video, you will learn about the Swarm Plot; its definition, complete overview and how you can create the Swarm Plot. This can be seen explained in detail by the instructor with examples like visualization of “fmri” dataset using swarm plot().
-
In this tutorial, you will learn a complete overview on Plotting Bivariate Distribution along with the concepts of Hexbin Plot, Kernel Density Estimation (KDE) and the Reg Plots. You will understand many of the in-depth concepts on these, with detailed explanation by the instructor with examples.
-
In this tutorial, you will learn about the Pair Plot Function in Visualizing Pairwise Relationship under Seaborn library. You will understand the complete overview of Pair Plot Function, the syntax for using it, the parameters used like hue, palette, kind and diag kind. This will be seen explained in detail by the instructor with the help of examples.
-
In this tutorial, you will learn about the Box Plot, Violin Plots and the Point Plots – their definitions and how to create them which will be seen explained in detail by the instructor throughout the video.
Course/Topic 5 - Data Visualization in R - all lectures
-
In this introductory tutorial on Data Visualization in R Programming, you will learn about what is data visualization, the type of graph or chart one should select for data visualization, what is the importance and benefits of data visualization and finally what are the applications of data visualization.
-
In this video, you will learn how to work on the Histogram, which falls under different Chart types used in Data Visualization in R Programming; along with working on the bar chart, box plot and heat map. You will be seeing a detailed explanation by the instructor on the complete workaround of these by taking different examples.
-
In this video, you will learn what is density plot and how you can create the density plot by taking different examples for it. You will also learn about the different applications being used in the density plot under Data Visualization with R Programming.
-
In this tutorial, you will learn about Data Visualization with GGPLOT2 Package where inside it you will learn the overview of GGPLOT2, iteratively building plots, univariate distributions and bar plot, annotation with GGPLOT2, axis manipulation and the density plot. You will get a complete understanding of the theoretical concept along with the implementation of each of these.
-
In this second part of the video tutorial, you will learn about Plotting with GGPLOT2 and building your plots iteratively, along with the importance of the ‘+’ symbol and its use in the GGPLOT2 work process. You will be seeing a detailed explanation from the instructor by taking different examples.
-
In this video you will learn about the complete theoretical and practical implementation of Univariate Distribution and Bar Plot, which can be seen explained in complete details by the instructor throughout the tutorial.
-
In this tutorial, you will learn about annotation with ggplot2, along with geom text () and adding labels with geom label () with complete explanation on this by the instructor with the help of different examples.
-
In this tutorial, you will learn about Axis Manipulation with ggplot2, its complete overview and in-depth concepts along with the different functions used during the process. You will be seeing explaining the topic in complete details by the instructor by taking examples and working in R studio.
-
In this section, you will learn about Text Mining and Word Cloud, along with the Radar Chart, Waffle Chart, Area Chart and the Correlogram. In this first part of the video, you will learn about the Text Mining and Word Cloud, the different reasons behind using Word Cloud for text data, who is using Word Clouds and the various steps involved in creating word clouds.
-
In this video, you will learn how to execute data using redline function. Also, you will understand the usage of corpus function and content transformer function. Further, you will understand about the text stemming, Term Document Matrix function and the Max word’s function.
-
In this tutorial, you will learn about the Radar Chart, the function used in the Radar Chart which is gg Radar (), scales, mapping and the use label. Along with this, you will also learn how to create Radar Chart in R studio. Moreover, you will learn about the Waffle Chart in R and how to create vector data in Waffle Chart with the help of different examples.
-
In this last part of the session, you will learn about the Area Chart, its in-depth concepts and how to work on it. This will be seen explained in detail by the instructor. Moreover, you will also learn about the Correlogram in R, the correlation matrix, Mt cars and the work around on different visualization methods been used.
-
This is a project tutorial titled Visualizing COVID-19 where you will see the different scenarios being explained by the tutor on visualizing COVID-19 data and how it can be done through Data Visualization in R process. In this first part, you will understand the complete overview of the project, its description and the different tasks associated with it being done by the ggplot.
-
In this second part of the project video, you will learn about the “Annotate” process and the number of COVID cases being reported in China with the help of Data Visualization. You will be seeing the task performed on the dataset being provided by the WHO along with understanding the tribble function and how it will help during the entire work process.
-
In this last part of the session, you will understand the work around of the task being done with the help of plot. You will see a detailed explanation by the instructor seeking help of few examples to explain the complete process of plotting in respect to the COVID-19 project being implemented.
Course/Topic 6 - Machine Learning with Python - all lectures
-
In this lecture session we learn about basic introduction to machine learning and also talk about This machine learning process starts with feeding them good quality data and then training the machines by building various machine learning models using the data and different algorithms.
-
In this lecture session we learn about types of machine learning in machine learning and also talk about their primary three types of machine learning we also explore and understand the different types of machine learning.
-
In this lecture session we learn about Supervised, Unsupervised, and Reinforcement Learning in brief and also talk about some features and factors of Supervised, Unsupervised, and Reinforcement machine Learning.
-
In this lecture session we learn about The primary rationale for adopting Python for machine learning is because it is a general purpose programming language that you can use both for research and development and in production. In this post you will discover the Python ecosystem for machine learning.
-
In this tutorial we learn about components of python ML Ecosystem in machine learning and also talk about features and factors of Object-Oriented Language: One of the key features of python is Object-Oriented programming. Python supports object-oriented language and concepts of classes, object encapsulation, etc.
-
In this tutorial we learn about what pandas is in machine learning and also talk about the pandas package of the most important tool in machine learning and all different tools in brief.
-
In this lecture session we learn about The most common data format for ML projects is CSV and it comes in various flavors and varying difficulties to parse. In this section, we are going to discuss three common approaches in Python to load CSV data files .
-
In this tutorial we learn about regression analysis helps one understand how the typical value of the dependent variable (or 'criterion variable') changes when any one of the independent variables is varied, while the other independent variables are held fixed and also talk about different types of Regression analysis.
-
In this tutorial we learn about how Linear regression is used to predict the value of a continuous dependent variable with the help of independent variables. Logistic and also talk about linear regression is both a statistical and a machine learning algorithm. Linear regression is a popular and uncomplicated algorithm used in data science and machine learning.
-
In this lecture session we learn about the scikit-learn library in machine learning and also talk about what Scikit-Learn is, how it’s used, and what its basic terminology is. While Scikit-learn is just one of several machine learning libraries available in Python, it is one of the best known. The library provides many efficient versions of a diverse number of machine learning algorithms.
-
In this lecture session we learn about creating a train and test dataset in machine learning and also talk about The test data set contains data you are going to apply your model to. In contrast, this data doesn’t have any "expected" output. During the test phase of machine learning, this data is used to estimate how well your model has been trained and to estimate model properties.
-
In this tutorial we learn about multiple regression is the extension of ordinary least-squares (OLS) regression because it involves more than one explanatory variable. Multiple linear regression (MLR), also known simply as multiple regression, is a statistical technique that uses several explanatory variables to predict the outcome of a response variable.
-
In this lecture session we learn about examples of multiple linear regression in machine learning and also talk about features and functions of Linear regression that can only be used when one has two continuous variables—an independent variable and a dependent variable.
-
In this tutorial we learn about Polynomial Regression is a regression algorithm that models the relationship between a dependent (y) and independent variable (x) as nth degree polynomial. The Polynomial Regression equation is given below: It is also called the special case of Multiple Linear Regression in ML.
-
In this lecture session we learn about classification in machine learning as a supervised learning approach and also talk about attempts to learn between a set of variables and a target set of variables of a test.
-
In this tutorial we learn about Logistic regression models to help you determine a probability of what type of visitors are likely to accept the offer — or not. As a result, you can make better decisions about promoting your offer or make decisions about the offer itself and also talk about The three types of logistic regression are: Binary logistic regression is the statistical technique used to predict the relationship between the dependent variable (Y) and the independent variable (X), where the dependent variable is binary in nature. For example, the output can be Success/Failure, 0/1 , True/False, or Yes/No.
-
In this lecture session we learn about what KNN K-nearest neighbors (KNN) is a type of supervised learning algorithm used for both regression and classification. KNN tries to predict the correct class for the test data by calculating the KNN
-
In this lecture session we learn about encoding data columns in machine learning Encoding is the process of converting the data or a given sequence of characters, symbols, alphabets etc., into a specified format, for the secured transmission of data. Decoding is the reverse process of encoding which is to extract the information from the converted format. Data Encoding.
-
In this tutorial we learn about decision trees in machine learning. Decision tree is the most powerful and popular tool for classification and prediction. A Decision tree is a flowchart like tree structure, where each internal node denotes a test on an attribute, each branch represents an outcome of the test, and each leaf node (terminal node) holds a class label.
-
In this lecture session we learn about Support Vector Machine Algorithm. Support Vector Machine (SVM) is a supervised machine learning algorithm used for both classification and regression. Though we say regression problems as well, it's best suited for classification.
-
In this lecture session we learn about An Overview of Clustering in the Cloud. Computer clusters, and in particular Kubernetes clusters, have seen a substantial rise in adoption in the last decade. Startups and tech giants alike are leveraging cluster-based architectures to deploy and manage their applications in the cloud.
-
In this lecture session we learn about Cluster analysis is an essential human activity. Cluster analysis is used to form groups or clusters of the same records depending on various measures made on these records. The key design is to define the clusters in ways that can be useful for the objective of the analysis.
-
In this lecture session we learn about Hierarchical clustering begins by treating every data point as a separate cluster. Then, it repeatedly executes the subsequent steps: Merge the 2 maximum comparable clusters. We need to continue these steps until all the clusters are merged together. In Hierarchical Clustering, the aim is to produce a hierarchical series of nested clusters.
-
In this tutorial we learn about implementation of Agglomerates hierarchical clusters in machine learning and also talk about features of hierarchical clusters.
-
In this tutorial we learn about Association Rule Learning is a rule-based machine learning technique that is used for finding patterns (relations, structures etc.) in datasets. By learning these patterns we will be able to offer some items to our customers.
-
In this tutorial we learn about Data Mining enables users to analyze, classify and discover correlations among data. One of the crucial tasks of this process is Association Rule Learning. An important part of data mining is anomaly detection, which is a procedure of search for items or events that do not correspond to a familiar pattern.
-
In this lecture session we learn that Recommender systems are so commonplace now that many of us use them without even knowing it. Because we can't possibly look through all the products or content on a website, a recommendation system plays an important role in helping us have a better user experience, while also exposing us to more inventory we might not discover otherwise.
-
In this lecture session we learn about Recommender Function. An important component of any of these systems is the recommender function, which takes information about the user and predicts the rating that user might assign to a product, for example. Predicting user ratings, even before the user has actually provided one, makes recommender systems a powerful tool.
-
In this lecture session we learn about Collaborative filtering is a difference of memory-based reasoning especially well appropriated to the application of supporting personalized recommendations. A collaborative filtering system begins with a history of personal preferences.
-
In this tutorial we learn about implementation of move recommender systems in machine learning and also talk about features and functions of implementation of move recommender systems in brief.
Course/Topic 7 - SAP BPC Classic - all lectures
-
In this lecture session we learn about introduction to SAP BPC classic module in SAP and also talk about features of SAP BPC classic.
-
In this lecture session we learn about environment and dimensions management in SAP BPC and also talk about functions of environment and dimension management in brief.
-
In this lecture session we learn about features of environment and dimensions management and also talk about the importance of dimensions management.
-
In this lecture session we learn about model creation in SAP BPC Classic and also talk about features of models creation in brief.
-
In this lecture session we learn about how we create a model in brief and also talk about features of models creation in SAP BPC classic.
-
In this lecture session we learn about hierarchy in BPC classic and also talk about functions of hierarchy in SAP BPC classic.
-
In this lecture session we learn about business object planning and consolidation in model creation and also talk about the function of model creation in SAP BPC classic.
-
In this lecture session we learn about BPC security RFC connection EPM add in SAP BPC Classic and also talk about features of BPC security in brief.
-
In this lecture session we learn about the new data access profile in SAP BPC classic and also talk about function of BPC security.
-
In this lecture session we learn about data loading data manager and transformation master and also talk about upload download flat file in SAP BPC classic.
-
In this lecture session we learn about data loading in SAP BPC data manager and also talk about features of transformation master in SAP.
-
In this lecture session we learn about data loading functions and also talk about organize run packages in SAP BPC Classic.
-
In this lecture session we learn about features of data loading data manager transformation and also talk about the importance of organizing run packages.
-
In this lecture session we learn about conversion transaction data in data loading and also talk about features of transformation in brief.
-
In this lecture session we learn about conversion transaction data in data loading and also talk about features of how we manage data.
-
In this lecture session we learn about data manager packages transaction data in transformation conversion in brief.
-
In this lecture session we learn about data manager packages and also talk about features of conversion of transaction data.
-
In this lecture session we learn about transformation conversion in data manager packages and also talk about features of SAP BPC transaction data.
-
In this lecture session we learn about features of data manager packages in transformation and conversion and also talk about function of data manager.
-
In this lecture session we learn about data loading and also talk about package links in transaction data reporting in SAP BPC.
-
In this lecture session we learn about data manager and also talk about package links in transaction in data reporting.
-
In this lecture session we learn about multi and axis sharing reports and also talk about input forms EPM in SAP BPC.
-
In this lecture session we learn about multi and axis sharing reports input forms and output forms in sharing reports.
-
In this lecture session we learn about publishing books drill through web reporting in journals backup restore in SAP BPC.
-
In this lecture session we learn about drill through and also talk about web reporting and also talk about features of backups restore.
-
In this lecture session we learn about script logics in SAP PBC Classic and also talk about script logis in journal backup restore.
-
In this lecture session we learn about script logics in SAP BPC and also talk about features of script logics in brief.
-
In this lecture session we learn about consolidation and ownership in SAP BPC Classic and also talk about features of consolidation and ownership in brief.
-
In this lecture session we learn about consolidation and ownership in SAP BPC and also talk about features consolidation and ownership in brief.
Course/Topic 8 - SAP MDG - all lectures
-
In this first video on the SAP Master Data Governance course, you will be learning about the MDG Deployment Options like Co-Deployment and Hub Deployment along with the overview of High-Level Architecture. You will also be learning about the concepts like Work Centers, Roles, Change Request, Workflow-Linear and Workflow-Parallel and the Staging Area Usage.
-
This video tutorial will teach you how to the complete work process of an SAP MDG Solution and how it is helpful for a business enterprise model. The trainer will also be showing how to work on the “Inactive Data Models” and the methodology of different MDG Solutions like Governance Integration, NWBC, ECC & HANA DB to name a few. Further, you will also be learning about the Simplified Process Flow of MDG.
-
In this tutorial, you will be learning about the Simplified Process Flow in SAP MDG along with the Business Partner Attributes; the Supplier and Customer Attributes. Further, you will be learning about the HTML-based user interface, data flow, and replication and how MDG helps the Business User and with User Interface, Data Quality functions, Material Class and Hierarchy Maintenance, Robust Data Replication, Template Creation, Mass Maintenance, and the Analytical features for the processes.
-
In this video, you will be learning about the 2 types of Deployment Options in the MDG system which are the Co-Deployment and Hub-Deployment options. The trainer will be seen explaining each and every detail in the difference between the two by taking examples of how it works in the real-time SAP MDG system.
-
In this video, you will learn about the communication work process between the Hub Deployment and ECC System. The trainer will be seen explaining the complete workaround of how the Co-Deployment and ECC Operation System works.
-
In this video, you will learn about the different entity types associated with the SAP MDG system. You will also be learning about the Root Table along with the MARA and the MARC table.
-
In this tutorial, you will learn about the concept of Mapping in the MDG system along with the different types of attributes and their types. The trainer will be showing the complete work process of the mapping between them in the SAP system of the “Inactive Data Model” of the screen.
-
In this tutorial, you will learn about the fundamental steps to configure a governance scenario like Data Model, User Interface, Change Request Process, User Access, and Using the newly created scenario. Further, you will be learning about the complete concept of the Data Model along with the Entity Types, SU Types Summary, and the Relationships with detailed explanation on the SAP system.
-
This video is a complete practical training on how to create a Data Model in the SAP MDG system. You will be seeing a detailed practical demonstration of the same by the trainer in the system.
-
In this video, you will be learning about the Business Rule Framework, its complete and detailed concept, Business Rule; Elements, Mode of Operations, Workflow Integration in BRF Plus. The trainer will be showing the BRF in the SAP system. Along with this, you will also be learning about the MDG UI configuration and under it parts like Business Activity, Logical Action, Change Request Type, and the CR Status.
-
In this video, you will learn about the concept of Step Type and how it is configured. Along with this, you will also be learning about the prerequisites for BRF, what is BRF Workflow, its Key Elements, User-Agent Table, and a complete step-by-step process of how BRF Workflow works.
-
In this video, you will learn about the Model to Dialog-Step-Agent Decision Table, Key Elements for Process Pattern like UI Dialog, Call Sub-Workflow, Call Data Replication, etc. You will be getting a detailed explanation of these Key Elements and also how all these works in the SAP MDG system.
-
In this tutorial, you will learn about the Static Workflow Template which will be shown in the SAP system. Further, you will be knowing about Floor Plan Manager –its Component Structure, FPM Component Interfaces, Sample Structure of FPM, and lastly about the Fluid Editor which is the tool for working of the FPM in the MDG system.
-
In this video, you will get complete practical knowledge on the FPM Workbench along with working on the Web Dynpro Application. The tutor will be seen explaining each and every step in the SAP MDG system.
-
In this video, you will be learning about the concepts of BOL and Genile which stand for Business Object Layer and Generic Interface Layer resp. The trainer will be seen explaining these concepts taking examples of the practical scenarios; its work process and along with this the component configuration in the SAP MDG system.
-
In this MDG tutorial, you will be learning about the concept of Roles; creating custom roles under Role Maintenance, change of roles, and others. Moreover, you will be learning about the nwbc screen elements under it concepts like adaptation, Feeder Class, etc and lastly, you will be seeing be having the knowledge on the various MDG UI Layers.
-
In this video, you will learn about the steps involved under Personalization, Customizing and Configuration in the SAP MDG work process, with a detailed component configuration of the steps shown by the trainer in the SAP system.
-
In this tutorial, the trainer will be seen explaining the various application programming contents, answering the queries of the students, and further you will get the knowledge of the Staging Table in SAP MDG.
-
This video is all about the various concepts associated with the MDG relevant APIs, its history along with different types of APIs like Convenience API, Governance API, and the Abstraction Layer. You will also be learning about the Reading Entity Data the complete work cycle of the API in the MDG system.
-
This tutorial is about how you can implement an access class to save data in the SAP MDG system. The trainer will be seen showing the step-by-step process of the implementation in the system.
-
This MDG tutorial is a complete practical demonstration of the API Programming work process, in addition to another work process in the system like ABAP Debugger, Class Builder, etc. The trainer will be seen explaining all the concepts in the MDG system.
-
This video is a small discussion on the previous MDG concepts being taught by the trainer throughout this course.
-
This video is a quick recap on the Feeder Class; what is it and how it works in the SAP MDG environment, along with some system-oriented concepts related to it.
-
In this video, you will be learning about the different activities associated with the SAP MDG module such as Analysing Application Log, Display Workflow, Process work items as Administrators, and others. Along with that, you will be getting an explanation on the Finance Accounting Governance with G/L account centrally and analyze log for outbound implementation.
-
In this video, you will be learning an in-depth and detailed concept of the Data Replication process in the SAP MDG system, with hands-on working on the data models, structure, and mapping in the system. Further, you will be knowing about Defining Business Systems, Creating a Business Object Type in MDG system, and defining object nodes.
-
In this tutorial, you will learn how to create and edit mappings in the MDG system. Furthermore, you will learn about the Service Mapping Tool, Defining Business Systems, Defining Object Nodes, Assigning Key Structures to Object Identifiers, Defining Filter Objects, and Creating Outbound Interface.
-
In this video, you will learn about Customer Vendor Integration (CVI) and the key concepts associated with it, while showing it in the SAP system such as Synchronization Options, Set BP Role Categories for Customer Integration, Defining Vendor Link for Business Partner Roles and others. You will also be learning about the Web Service Configuration and the Replication Model in the SAP MDG module.
-
This last video on the SAP MDG course will teach you how to define an outbound implementation, business objects, and Web Service Configuration in the SAP MDG system. You will be getting a detailed step-by-step process of the whole workflow.
Course/Topic 9 - Cloud Computing Basics - all lectures
-
In this lecture session we learn about cloud computing, which means storing and accessing data over the internet instead of a hard disk. It is defined as a service that provides users to work over the internet.
-
In this lecture session we learn about cloud computing is the delivery of computing services—including servers, storage, databases, networking, software, analytics, and intelligence—over the Internet (“the cloud”) to offer faster innovation, flexible resources, and economies of scale.
-
In this lecture session we learn about Cloud computing is a general term for anything that involves delivering hosted services over the internet. These services are divided into three main categories or types of cloud computing.
-
In this tutorial we learn about the importance of cloud computing can be found in using services like Google Drive and Apple iCloud. The use of these services allows documents, contacts, pictures, and a whole lot more online.
Course/Topic 10 - SQL Programming with MySQL Database - all lectures
-
In this video get an in-depth introduction to the terminology, concepts, and skills you need to understand database objects, administration, security, and management tools. Plus, explore T-SQL scripts, database queries, and data types
-
In this video learn basic of SQL Programming and overview the SQL basic commands and how we use these commands in SQL Programming. This SQL tutorial will teach you basics on how to use SQL in MySQL, SQL Server, MS Access, Oracle, Sybase, Informix, Postgres, and other database systems.
-
In this video we talk about DDL (DATA DEFINATION LANGUAGE) and also cover all the basic techniques of DDL.In this video we will learn about the SQL commands – DDL, DML, DCL; SQL Constraints – Keys, Not Null, Check , Default, and also MYSQL Hands-on and basic Querying
-
In this video session we learn SQL commands and how to use these commands like select command, insert command, delete command etc. In this video we will learn about hands-on experience on the terminal, creating database, Tables and manipulating data.
-
In this video we learn about SQL Basic and Aggregate Functions and also cover different functions of SQL. This tutorial teaches us about clauses and the update command. We will also cover making records, updating and modifying rows.
-
In this session we talk about SQL Regular Expression and we also cover all techniques of SQL Regular Expression.This tutorial teaches us about clauses and the update command. We will also cover making records, updating and modifying rows and EML commands.
-
In this video we learn about SQL Comparison Clauses and how we use Comparison Clauses in SQL. This tutorial covers Comparison Operators by relating values by a mathematical symbol which is used to compare two values. Learn about comparison operators result - TRUE, FALSE, or UNKNOWN
-
In this session we learn about SQL String and also cover all types of string in SQL and how we can use SQL Strings. In this video we will learn about the basic string functions such as concat_ws, file format, and insert function, L-case, u case, and lower case. We will also learn about basic functions such as upper functions.
-
In this session we cover advance level string function and also cover all different commands we use in SQL String Function. This video is a sequel for string functions tutorial. In this tutorial we will learn few most useful string functions such as spaces and null issue as well, L-Pad command.
-
In this SQL String function part 3 we learn select Repeat function and Select Replace function and also cover different between Select Repeat function and Select Replace function. This tutorial is another sequel to string functions, however, these functions are used less and not used that frequently. We will further learn here about the repeat function, absolute function, ceiling, and floor and down functions.
-
In this session we learn about SQL Numeric Functions and how we use Numeric functions in SQL. In this video, we will be covering numerical functions. Learn about the basic date functions and also about truncate functions.
-
In this video session we learn about SQL Numeric Function and also cover the basic functionality of SQL Numeric Function. SQL Data Functions. In this video we will learn about few more Date functions. We will further look into the day function option as well. This tutorial covers basic querying over a single table.
-
: In this video we talk about SQL Joins Introduction and Demonstration and basic join’s function and how to make table using joins. In this tutorial learn about joints in SQL. This tutorial teaches us how to connect two different tables with joints. We will also cover the topic of querying two or more tables and about subquery .
-
In this lecture last session we talk about MySQL Workbench and procedures and Views and MySQL Workbench functionality. In this tutorial learn about SQL in automating things. This tutorial covers stroll procedure, functions and views which are helpful for automation purposes in SQL.
After the completion of this course, you will be able to learn:
1).How to use data to improve business
2).How to understand your customers and markets
3).How to provide data-driven services
4).How to build more intelligent products
5).How to source and collect data
6).How to turn data into insights
Career Path: Data Strategist Syllabus
Module 1: Introduction to Data Strategy In this foundational module, participants will explore the concept of data strategy and its significance in today’s data-driven landscape. The module covers the role of a Data Strategist within organizations, the importance of aligning data initiatives with business goals, and the key competencies required for success. Participants will gain insights into how data can be leveraged to drive innovation, enhance decision-making, and create competitive advantages.
Module 2: Understanding Data Ecosystems This module delves into the various components of data ecosystems, including data sources, data types, and data management practices. Participants will learn about structured and unstructured data, data storage solutions, and the tools and technologies that support data collection and analysis. Emphasis will be placed on understanding data governance, data quality, and the importance of maintaining a secure and ethical data environment.
Module 3: Data Analysis and Visualization Techniques Participants will explore essential data analysis techniques and visualization tools in this hands-on module. Topics include descriptive statistics, exploratory data analysis (EDA), and the use of tools such as Tableau, Power BI, and Python libraries (e.g., Matplotlib, Seaborn) for data visualization. The module aims to equip participants with the skills to interpret data effectively and communicate insights in a clear and impactful manner.
Module 4: Building a Data-Driven Culture Creating a data-driven culture is crucial for the success of any data strategy. This module focuses on fostering a mindset that values data across all levels of an organization. Participants will learn strategies for promoting data literacy, encouraging data-driven decision-making, and overcoming resistance to change. Case studies will illustrate successful implementations of data-driven cultures in various organizations.
Module 5: Advanced Analytical Techniques This module introduces participants to advanced analytical methods, including predictive analytics, machine learning, and artificial intelligence. Participants will gain an understanding of how these techniques can be applied to solve complex business problems and enhance strategic planning. Practical exercises will enable learners to apply these concepts in real-world scenarios, reinforcing their analytical capabilities.
Module 6: Data Strategy Development and Implementation In this critical module, participants will learn how to develop and implement a comprehensive data strategy. Topics include identifying business objectives, conducting data audits, and defining key performance indicators (KPIs) to measure success. Participants will also explore frameworks for aligning data initiatives with organizational goals and will engage in hands-on projects to create actionable data strategies tailored to specific business contexts.
Module 7: Ethical Considerations and Compliance As organizations increasingly rely on data, ethical considerations and compliance become paramount. This module addresses data privacy, security, and regulatory frameworks such as GDPR and CCPA. Participants will learn about the ethical implications of data usage, the importance of transparency in data practices, and how to implement data governance policies that ensure compliance while fostering trust.
Module 8: Career Development and Networking for Data Strategists The final module focuses on career development strategies specific to the data strategist role. Participants will learn how to build a strong professional portfolio, enhance their personal brand, and effectively navigate the job market. Networking strategies, mentorship opportunities, and tips for interview preparation will also be covered, empowering participants to take proactive steps in advancing their careers in data strategy.
Conclusion
By the end of this course, participants will possess a comprehensive understanding of the data strategist role and the skills necessary to develop and implement effective data strategies. They will be equipped to leverage data for strategic decision-making, foster a data-driven culture, and navigate the ethical complexities of data usage. With practical experience and strategic insights, participants will be prepared to drive impactful data initiatives within their organizations and advance their careers in this dynamic field.
The Data Strategist Certification ensures you know planning, production and measurement techniques needed to stand out from the competition.
Data strategists manage the whole process of sourcing alternative datasets, often working closely with quants, data scientists and portfolio managers. They help to screen datasets to select those which are likely to show promise and fit the requirements of the business.
More specifically, data strategists need a good general knowledge of data infrastructure, frameworks and data management tools, but do not need to be highly experienced or skilled in engineering those frameworks and tools. A data strategy is a highly dynamic process employed to support the acquisition, organization, analysis, and delivery of data in support of business objectives.
Data strategists manage the whole process of sourcing datasets, often working closely with quants, data scientists and portfolio managers. They help to screen datasets to select those which are likely to show promise and fit the requirements of the business. Data strategists manage the whole process of sourcing alternative datasets, often working closely with quants, data scientists and portfolio managers. They help to screen datasets to select those which are likely to show promise and fit the requirements of the business. Quants and data scientists then test these shortlisted datasets in a rigorous process.
Business people know that foresight and good business strategy are essential for maintaining a competitive position. Data strategies are typically developed by business managers seeking buy-in from business leaders. On the other hand, data scientists and data engineers continue to generally have organizational alignment with IT or digital operations, even though the data strategy and vision will be developed by business people. Therefore, there is a current, and growing, need for a translational role between the data professional and business manager/leader.
Uplatz online training guarantees the participants to successfully go through the Data Strategist Certification provided by Uplatz. Uplatz provides appropriate teaching and expertise training to equip the participants for implementing the learnt concepts in an organization.
Course Completion Certificate will be awarded by Uplatz upon successful completion of the Data Strategist online course.
The Data Strategist Draws an average salary of $120.000 per year depending on their knowledge and hands-on experience. The Data StrategistAdmin job roles are in high demand and make a rewarding career.
Data strategists manage the whole process of sourcing alternative datasets, often working closely with quants, data scientists and portfolio managers. They help to screen datasets to select those which are likely to show promise and fit the requirements of the business.
Yes, data analytics is a good career choice as data has become a significant part of any industry to make strategic and informed decisions. This increases the demand for data analyst thereby making it one of the best career choices.
Note that salaries are generally higher at large companies rather than small ones. Your salary will also differ based on the market you work in.
1).Data Visualization Developer
2).Data Science Consultant
3).Supply Chain Specialist - Data Science
Q1:What are the key differences between Data Analysis and Data Mining?
Ans-Data analysis involves the process of cleaning, organizing, and using data to produce meaningful insights. Data mining is used to search for hidden patterns in the data. Data analysis produces results that are far more comprehensible by a variety of audiences than the results from data mining.
Q2: What is Data Validation?
Ans-Data validation, as the name suggests, is the process that involves determining the accuracy of data and the quality of the source as well. There are many processes in data validation but the main ones are data screening and data verification.
a) Data screening: Making use of a variety of models to ensure that the data is accurate and no redundancies are present.
b) Data verification: If there is a redundancy, it is evaluated based on multiple steps and then a call is taken to ensure the presence of the data item.
Q3: What is Data Analysis, in brief?
Ans-Data analysis is the structured procedure that involves working with data by performing activities such as ingestion, cleaning, transforming, and assessing it to provide insights, which can be used to drive revenue. Data is collected, to begin with, from varied sources. Since the data is a raw entity, it has to be cleaned and processed to fill out missing values and to remove any entity that is out of the scope of usage.
After pre-processing the data, it can be analyzed with the help of models, which use the data to perform some analysis on it.The last step involves reporting and ensuring that the data output is converted to a format that can also cater to a non-technical audience, alongside the analysts.
Q4: How to know if a data model is performing well or not?
Ans-This question is subjective, but certain simple assessment points can be used to assess the accuracy of a data model. They are as follows:
1).A well-designed model should offer good predictability. This correlates to the ability to be easily able to predict future insights when needed.
2).A rounded model adapts easily to any change made to the data or the pipeline if need be.
3).The model should have the ability to cope in case there is an immediate requirement to large-scale the data.
4).The model’s working should be easy and it should be easily understood among clients to help them derive the required results.
Q5: Explain Data Cleaning in brief.
Ans-Data Cleaning is also called Data Wrangling. As the name suggests, it is a structured way of finding erroneous content in data and safely removing them to ensure that the data is of the utmost quality. Here are some of the ways in data cleaning:
1).Removing a data block entirely
2).Finding ways to fill black data in, without causing redundancies
3).Replacing data with its mean or median values
4).Making use of placeholders for empty spaces
Q6:What are some of the problems that a working Data Analyst might encounter?
Ans-There can be many issues that a Data Analyst might face when working with data. Here are some of them:
1).The accuracy of the model in development will be low if there are multiple entries of the same entity and errors concerning spellings and incorrect data.
2).If the source the data being ingested from is not a verified source, then the data might require a lot of cleaning and preprocess before beginning the analysis.
3).The same goes for when extracting data from multiple sources and merging them for use.
4).The analysis will take a backstep if the data obtained is incomplete or inaccurate.
Q7: What is Data Profiling?
Ans-Data profiling is a methodology that involves analyzing all entities present in data to a greater depth. The goal here is to provide highly accurate information based on the data and its attributes such as the datatype, frequency of occurrence, and more.
Q8:What are the scenarios that could cause a model to be retrained?
Ans-Data is never a stagnant entity. If there is an expansion of business, this could cause openings of sudden opportunities that might call for a change in the data. Furthermore, assessing the model to check its standing can help the Analyst analyze whether the model is to be re-trained or not.
However, the general rule of thumb is to ensure that the models are re-trained when there is a change in the business protocols and offerings.
Q9: What are the prerequisites to become a Data Analyst?
Ans-There are many skills that a budding Data Analyst needs. Here are some of them:
1).Being well-versed in programming languages such as XML, JavaScript, and ETL frameworks
2).Proficient in databases such as SQL, MongoDB, and more
3).Ability to effectively collect and analyze data
4).Knowledge of database designing and data mining
5).Having the ability/experience of working with large datasets
Q10: What are the top tools used to perform Data Analysis?
Ans-There is a wide spectrum of tools that can be used in the field of data analysis. Here are some of the popular ones:
1) Google Search Operators
2) RapidMiner
3) Tableau
4) KNIME
5) OpenRefine
Q11: What is an outlier?
Ans-An outlier is a value in a dataset that is considered to be away from the mean of the characteristic feature of the dataset. There are two types of outliers: univariate and multivariate.
Q12:How can we deal with problems that arise when the data flows in from a variety of sources?
Ans-There are many ways to go about dealing with multi-source problems. However, these are done primarily to solve the problems of:
1).Identifying the presence of similar/same records and merging them into a single record
2).Re-structuring the schema to ensure there is good schema integration
Q13: What are some of the popular tools used in Big Data?
Ans-There are multiple tools that are used to handle Big Data. Some of the most popular ones are as follows:
1).Hadoop
2).Spark
3).Scala
4).Hive
5).Flume
6).Mahout
Q14: What is the use of a Pivot table?
Ans-Pivot tables are one of the key features of Excel. They allow a user to view and summarize the entirety of large datasets simply. Most of the operations with Pivot tables involve drag-and-drop operations that aid in the quick creation of reports.
Q15: Explain the KNN imputation method, in brief.
Ans-KNN is the method that requires the selection of several nearest neighbors and a distance metric at the same time. It can predict both discrete and continuous attributes of a dataset.A distance function is used here to find the similarity of two or more attributes, which will help in further analysis.