Career Path - Insights Analyst
Transform business decisions with data-driven insights—master analysis, reporting, and strategic storytelling as an Insights AnalystPreview Career Path - Insights Analyst course
Price Match Guarantee Full Lifetime Access Access on any Device Technical Support Secure Checkout Course Completion Certificate 92% Started a new career
BUY THIS COURSE (GBP 99)
-
 88% Got a pay increase and promotion
Students also bought -
-

- Career Path - AI/ML Research Scientist
- 200 Hours
- GBP 99
- 368 Learners
-

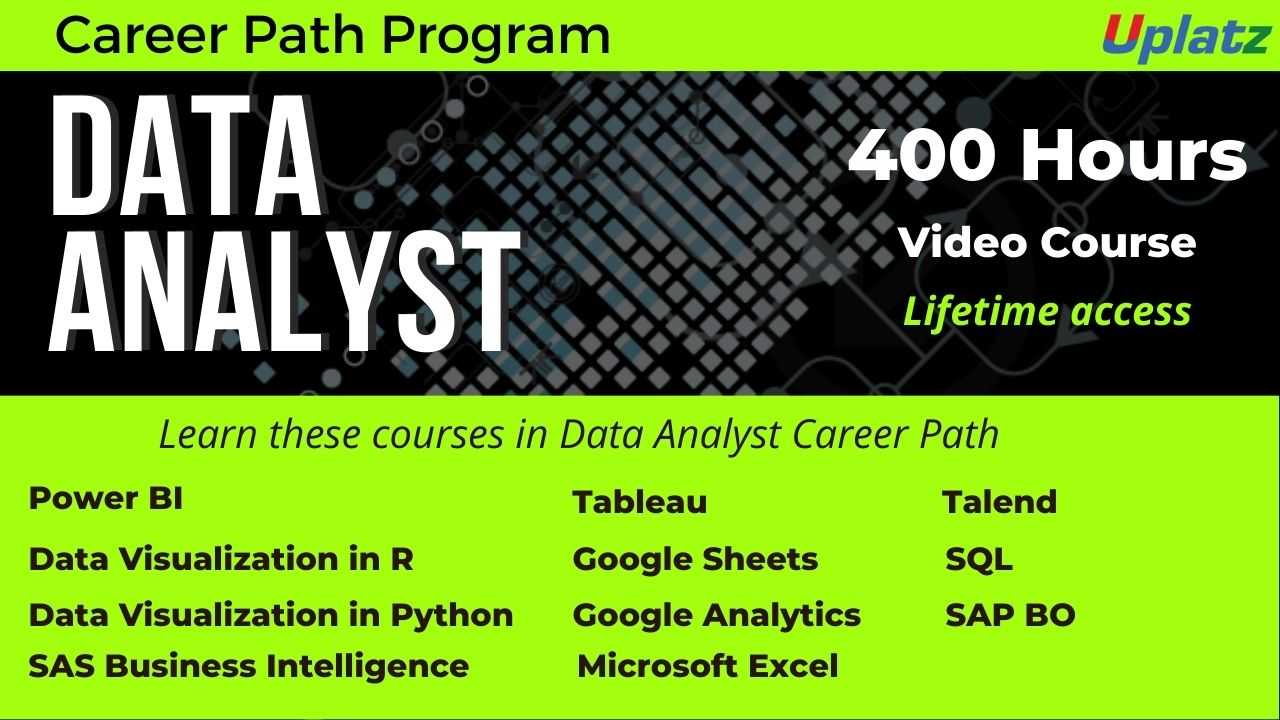
- Career Path - Data Analyst
- 400 Hours
- GBP 99
- 6488 Learners
-

- Career Path - Financial Analyst
- 350 Hours
- GBP 99
- 453 Learners

Career Path - Insights Analyst – Self-Paced Online Course
The Insights Analyst Career Path – Self-Paced Online Course is your gateway to mastering the essential skills required for one of today’s most impactful and in-demand roles in data and business intelligence. Designed for aspiring and early-career professionals, this course provides a deep, hands-on introduction to the tools, methodologies, and strategic thinking needed to extract actionable insights from complex data.
Whether you’re new to data analysis or transitioning from a related role—such as a marketing analyst, operations specialist, or business associate—this course offers the technical foundation and business acumen needed to thrive as an Insights Analyst. You will not only learn how to handle data but also how to make it tell a story that informs decisions, drives business strategies, and creates value across departments.
As the modern business landscape becomes more data-centric, companies are seeking professionals who can bridge the gap between raw data and decision-making. An Insights Analyst plays a pivotal role in this transformation. The role involves collecting and preparing data, performing analytical exploration, visualizing trends, and communicating findings to both technical and non-technical stakeholders. This course is specifically built to help you succeed in that role with real-world relevance, hands-on activities, and expert-led instruction.
What This Course Offers
This self-paced course is designed to give you complete flexibility while offering a structured learning experience. The curriculum has been carefully crafted by industry professionals to guide you through the full spectrum of an Insights Analyst’s responsibilities—from working with raw data to delivering clear, concise insights that drive business actions.
Here’s what the course emphasizes:
- Core Technical Skills: You’ll gain proficiency in Excel, SQL, and Business Intelligence (BI) tools like Power BI and Tableau—cornerstones of data analysis workflows. These tools are used across industries for data manipulation, visualization, and dashboard creation.
- Data Handling & Preparation: Learn how to clean, transform, and model data effectively. Real-world datasets are used to replicate practical scenarios and build familiarity with real business contexts.
- Analytics & Insight Generation: Beyond technical work, the course teaches you how to derive meaningful patterns, identify key trends, and generate insights that solve business problems.
- Communication & Storytelling: A crucial part of the analyst’s role is to communicate findings. This course includes modules on data storytelling, visualization best practices, and how to tailor your communication to different audiences—from technical teams to executive stakeholders.
- Soft Skills & Strategic Thinking: Learn how to ask the right questions, align analytics work with business objectives, and present insights that drive strategic decision-making.
Each lesson is supported by pre-recorded video content, hands-on projects, and case-based examples drawn from industries such as retail, finance, healthcare, and tech—giving you a well-rounded, real-world perspective.
Who Should Take This Course
This course is ideal for:
- Beginners in Data & Analytics looking to enter the field with a strong, guided learning path.
- Career Changers from roles in marketing, operations, finance, or customer service who want to pivot into analytics.
- Junior Analysts or Assistants who want to level up their skills and move into a dedicated Insights Analyst role.
- Students & Recent Graduates in business, statistics, economics, computer science, or related fields who need job-ready, practical skills.
No prior experience in data analysis is required—just a willingness to learn, a curiosity for data, and a desire to uncover the stories data can tell.
How to Use This Course
To maximize your learning experience and progress efficiently through the course, here are some best practices on how to use it effectively:
- Set Clear Goals: Before starting, take time to understand why you want to become an Insights Analyst. Are you aiming for your first job, trying to enhance your resume, or preparing for a promotion? Define your goals so you can track your progress and stay motivated.
- Commit to a Schedule: As this is a self-paced course, consistency is key. Set aside specific hours each week dedicated to learning. Whether it’s one hour a day or longer weekend sessions, a regular schedule will help you build momentum.
- Start from the Beginning: Even if you’re already familiar with some tools like Excel or SQL, begin the course from the start. The foundational modules ensure you have a solid base, which is critical for understanding more advanced concepts later.
- Engage with Hands-On Projects: The practical exercises and mini-projects are essential for building confidence and experience. Don’t just watch the videos—pause, replicate, and test what you’ve learned in your own environment.
- Take Notes and Create Summaries: As you move through the modules, create your own summaries and insights. This will help reinforce your understanding and serve as valuable revision material for future interviews or real-world work.
- Revisit Difficult Topics: Don’t be afraid to repeat videos or rework practice exercises. Mastery takes time, especially when learning data tools and analytical frameworks for the first time.
- Build Your Portfolio: Document your work as you complete assignments and projects. Screenshots of dashboards, SQL queries, or insight summaries can all form part of a personal analytics portfolio to showcase your skills to future employers.
- Apply What You Learn Immediately: Try to use your new skills on real or simulated business problems. You can use public datasets (e.g., from Kaggle or government portals) to practice your analysis skills in different domains.
- Ask Questions & Research Independently: As you progress, you’ll naturally come across terms or techniques that you want to explore further. Take time to dive deeper into topics that interest you—this curiosity is essential for long-term success in analytics.
- Review & Reflect: After completing key sections, pause and reflect on what you've learned. Write a short summary of how you might use these skills in a business context or in your current role.
The Career Path - Insights Analyst – Self-Paced Online Course is a powerful, practical training program that empowers you to turn data into actionable business insights. With industry-relevant tools, project-based learning, and the flexibility to progress at your own pace, this course prepares you for one of the most versatile and rewarding roles in the data landscape.
By the end of the course, you will not only have the technical knowledge to perform analytics tasks but also the strategic thinking and communication skills to influence decisions and drive change within any organization. Begin your journey toward a future in analytics and transform your career potential today.
Course/Topic - Course access through Google Drive
-
Google Drive
-
Google Drive
By the end of this course, learners will be able to:
- Understand the responsibilities and career progression of an Insights Analyst
- Work with data to derive actionable business insights
- Use tools like Excel, SQL, Power BI, and Tableau to create interactive reports and dashboards
- Apply statistical techniques to interpret trends, patterns, and customer behavior
- Conduct market, customer, and performance analysis for business decision-making
- Communicate findings clearly through data storytelling and visualizations
- Collaborate across product, marketing, and sales teams
- Prepare for certifications and interviews in data and business analytics
Syllabus:
- Introduction to Insights Analytics
- Overview of insights analysis
- Understanding business impact and data-driven decision-making
- Data Collection and Cleaning
- Gathering data from multiple sources
- Data preparation and transformation (Excel, SQL, ETL basics)
- Exploratory Data Analysis (EDA)
- Detecting trends, patterns, and anomalies
- Descriptive statistics and data summarization
- SQL for Data Analysis
- Writing queries, joins, filters, aggregations
- Subqueries, CTEs, and window functions
- Data Visualization and Reporting
- Power BI and Tableau fundamentals
- Building dashboards, KPIs, and visual storytelling
- Customer and Market Insights
- Segmentation, retention, churn analysis
- Market research and competitor analysis
- Business Performance Analysis
- Sales, revenue, and campaign performance tracking
- Metrics and KPIs for business units
- Presenting Insights and Recommendations
- Communicating data findings to non-technical stakeholders
- Insight reports, executive summaries, and storytelling
- Real-World Case Studies
- Industry examples: retail, healthcare, fintech, and marketing
- Role-based use cases and analysis projects
- Career Planning & Certification Prep
- Resume writing, portfolio creation, and interview prep
- Certification pathways in data and insights roles
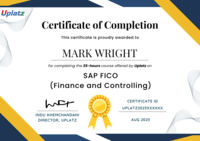
Upon successful completion, learners will receive a Course Completion Certificate from Uplatz, confirming their expertise in data analysis, reporting, and business insight generation.
This Uplatz certification demonstrates your ability to work with data tools, interpret trends, and contribute to data-driven decision-making across industries. It adds significant value to your resume and helps you stand out in roles such as BI Analyst, Market Analyst, and Customer Insights Specialist.
The course also prepares learners for entry-level and intermediate certifications such as:
- Microsoft Certified: Power BI Data Analyst Associate
- Google Data Analytics Professional Certificate
- Tableau Desktop Specialist
- SQL for Data Analysis Credentials
This certification opens the door to insights, analytics, and strategy roles across multiple departments.
Insights Analysts are in high demand as businesses rely heavily on data to drive strategic decisions, understand customers, and optimize performance.
Career Opportunities Include:
- Insights Analyst
- Business Intelligence (BI) Analyst
- Marketing or Customer Insights Analyst
- Research Analyst
- Product Analyst
- Sales or Revenue Analyst
- UX Researcher
Industries Hiring:
Finance, retail, healthcare, SaaS, e-commerce, telecom, logistics, media, and marketing agencies.
Career Advancement Options:
- Senior Insights Analyst
- Insights Manager or BI Manager
- Director of Analytics or Head of Insights
- Chief Analytics Officer (CAO) or Chief Data Officer (CDO)
With the growing value of data in all decision-making, this role provides excellent career stability, cross-functional exposure, and long-term leadership potential.
1. What does an Insights Analyst do?
An Insights Analyst transforms raw data into actionable recommendations to support business strategy, marketing, and product development.
2. How is an Insights Analyst different from a Data Analyst?
While both work with data, Insights Analysts focus more on business interpretation and communicating strategic implications of data.
3. What tools are commonly used by Insights Analysts?
Excel, SQL, Power BI, Tableau, Google Analytics, and statistical tools like R or Python (for advanced roles).
4. What is data storytelling?
It's the art of using visuals and narratives to communicate data-driven insights clearly to stakeholders.
5. How do you prioritize which insights to share?
By aligning insights with business goals, KPIs, and the audience’s decision-making needs.
6. What is cohort analysis and where is it used?
It’s grouping users by shared characteristics over time (e.g., signup month) to track behavior, often used in retention analysis.
7. What’s the difference between descriptive and predictive analytics?
Descriptive tells you what happened; predictive uses data to forecast future trends or behavior.
8. How do you ensure data quality?
By performing validation checks, using clean data sources, handling missing values, and cross-referencing with trusted reports.
9. What types of dashboards would you build for marketing teams?
Campaign performance, customer acquisition, engagement metrics, and ROI tracking dashboards.
10. What challenges do Insights Analysts face?
Data silos, lack of data literacy in teams, unclear KPIs, and communicating complex results to non-technical audiences.


