OpenLLMetry
Instrument and monitor LLM pipelines with OpenLLMetry to gain full-stack visibility into prompt flows, latency, and usage metrics.Preview OpenLLMetry course
Price Match Guarantee Full Lifetime Access Access on any Device Technical Support Secure Checkout Course Completion Certificate 94% Started a new career
BUY THIS COURSE (GBP 29)
-
 84% Got a pay increase and promotion
Students also bought -
-

- AI-Powered DevOps: Using GitHub Copilot, CodeGuru & AIOps
- 10 Hours
- GBP 29
- 10 Learners
-

- PromptOps
- 10 Hours
- GBP 29
- 10 Learners
-

- TruLens
- 10 Hours
- GBP 29
- 10 Learners

OpenLLMetry is an open observability framework built specifically for LLMs. Inspired by OpenTelemetry, it allows teams to trace prompts, monitor latency and token usage, detect errors, and collect metrics across chains, APIs, and model responses.
This course teaches you how to integrate OpenLLMetry into your LLM application, configure trace pipelines, log and visualize prompt flows, and export metrics to observability platforms like Grafana or Prometheus. You'll learn to track failures, identify latency bottlenecks, and audit usage at scale.
Course/Topic 1 - Coming Soon
-
The videos for this course are being recorded freshly and should be available in a few days. Please contact info@uplatz.com to know the exact date of the release of this course.
-
Understand the importance of observability in LLM systems
-
Set up OpenLLMetry for tracing LLM prompt workflows
-
Track latency, error rates, and token usage in production
-
Configure exporters to Grafana, Prometheus, or Elastic
-
Visualize prompt chains and identify failure points
-
Integrate with LangChain and custom LLM pipelines
-
Monitor multi-agent systems and asynchronous tasks
-
Collect usage analytics for model governance and cost tracking
-
Debug long-running LLM chains and identify stuck processes
-
Apply standardized monitoring for LLMOps environments
Course Syllabus
-
Introduction to LLM Observability and OpenLLMetry
-
What is OpenLLMetry? Concepts and Architecture
-
Installing OpenLLMetry in Python Environments
-
Instrumenting LLM Applications with Tracing Hooks
-
Capturing Prompt Metadata, Responses, and Errors
-
Exporting Metrics to Grafana, Prometheus, and More
-
Working with LangChain Traces and Callback Handlers
-
Monitoring Token Usage, Latency, and Failures
-
Analyzing LLM Chains with Visualization Dashboards
-
OpenLLMetry for Multi-Agent and RAG Pipelines
-
Cost Monitoring and Governance Applications
-
Case Study: Full-Stack Observability in a QA LLM App
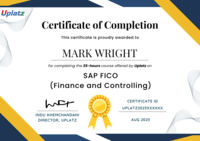
Upon completing this course, learners will receive a Uplatz Certificate of Completion verifying their expertise in implementing LLM observability using OpenLLMetry. This certificate confirms your ability to trace prompt flows, monitor model behavior, and manage AI infrastructure with precision. It demonstrates practical, job-ready skills for AI DevOps, MLOps, and observability engineering. Earning this certificate is a great step toward becoming a technical leader in LLM system reliability and governance.
As LLM applications enter production across industries, monitoring and reliability become core responsibilities. Mastering OpenLLMetry prepares you for high-impact operational roles in AI infrastructure and observability.
Career paths include:
-
AI Observability Engineer
-
LLMOps Specialist
-
ML Infrastructure Engineer
-
DevOps for AI Systems
-
Prompt Monitoring Analyst
-
AI Platform Reliability Engineer
These roles are critical in companies deploying chatbots, RAG systems, agents, and summarizers across domains such as SaaS, healthcare, education, and enterprise tools. OpenLLMetry enables full visibility and transparency—skills that will make you a key player in deploying safe and scalable LLMs.
-
What is OpenLLMetry?
OpenLLMetry is an open observability framework designed to trace, monitor, and analyze large language model applications. -
How is OpenLLMetry different from OpenTelemetry?
It applies the same principles to LLM pipelines, focusing on prompt tracing, token usage, and AI-specific metrics. -
What are the benefits of using OpenLLMetry?
It provides visibility into LLM operations, detects latency issues, and enables standardized monitoring across AI stacks. -
How do you integrate OpenLLMetry with LangChain?
By attaching callback handlers and using middleware to trace each step of the chain execution. -
Can OpenLLMetry export metrics to existing dashboards?
Yes, it supports exporters for Grafana, Prometheus, and similar observability platforms. -
What kind of data does OpenLLMetry capture?
It captures prompt content, timing, token usage, success/failure status, and trace IDs. -
Why is observability critical in LLMOps?
Observability helps ensure model reliability, trace failures, monitor usage, and manage costs in production. -
Can OpenLLMetry track asynchronous agents or workflows?
Yes, it supports distributed tracing even for multi-agent and async execution flows. -
What are typical issues detected using OpenLLMetry?
Latency spikes, unhandled errors, excessive token usage, and long response chains. -
Is OpenLLMetry suitable for production systems?
Yes, it is designed to work in real-time, production-grade LLM environments for observability at scale.


