Build your Career in Data Science
You will learn the techniques of recording, analyzing, and storing data to extract insights, future predictions from structured and unstructured data.Preview Build your Career in Data Science course
Price Match Guarantee Full Lifetime Access Access on any Device Technical Support Secure Checkout Course Completion Certificate 96% Started a new career
BUY THIS COURSE (
96% Started a new career
BUY THIS COURSE (GBP 12 GBP 29 )-
 97% Got a pay increase and promotion
Students also bought -
-

- Data Science with Python
- 45 Hours
- GBP 12
- 2931 Learners
-

- Bundle Combo - Data Science (with Python and R)
- 70 Hours
- GBP 22
- 3110 Learners
-

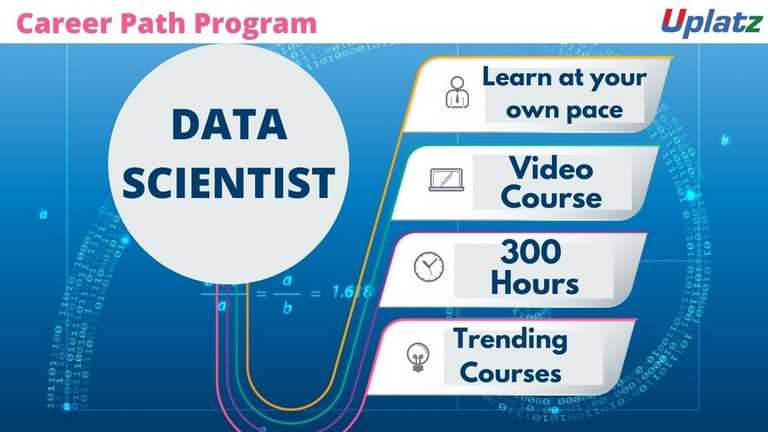
- Career Path - Data Scientist
- 300 Hours
- GBP 32
- 6978 Learners

Data science is an interdisciplinary subject that uses scientific techniques, procedures, algorithms, and systems to extract information and insights from structured and unstructured data, as well as to apply that knowledge and actionable insights to a variety of application areas. Data mining, machine learning, and big data are all linked to data science.
Data science is an interdisciplinary approach to deriving meaningful insights from today's businesses' massive and ever-increasing amounts of data. Preparing data for analysis and processing, doing sophisticated data analysis, and presenting the results to expose trends and allow stakeholders to make educated decisions are all part of data science. Data needs to be collected from multiple sources and analyzed. Data analysis and visualization have to be performed on the data to get valuable insights into the data. Machine learning tools are deployed to build predictive models that transform the raw data into actionable information. Knowledge Representation and Artificial Intelligence algorithms are creating intelligent machines capable of solving complex problems. Trending technologies like cloud computing, blockchain, quantum computing are transforming data science. Effective data architecture needs to be designed for useful storage and retrieval.
Making sense of the enormous data available is a challenge, the Data Scientist requires skills in diverse areas such as computational mathematics, data analytics, machine learning, artificial intelligence, data visualization, and even programming languages. In addition, knowledge is required in diverse domains like statistics, business, economics, finance, production etc. Hence the skill set required for data science is inter-disciplinary.
The data scientist is one who has been working in diverse domains. The data scientist is able to define the problem statement, project objectives in line with the business goals. They help identify patterns and trends using artificial intelligence, machine learning and make predictions based on data. They are required to have a strong background in the related subjects of artificial intelligence, machine learning, statistics and data engineering.
These videos will explain how to build your career in the data science industry, by helping you identify the different careers in data science and boost your efficiency in discovering suitable data science roles.
These videos will also give you the know-how you need to pursue your professional data science path.
Course/Topic - Build your Career in Data Science - all lectures
-
In this lecture about how to learn data science with a step by step explanation. This video will talk about the career path in data science specially from a fresher’s point of view. Further we will talk about the skills required to become a successful data scientist and also about the compensation of a data scientist. Lastly we will see the platforms and data science tools used to learn data science. This video also clarifies whether a person would need a degree for a successful career in data science.
-
This video talk majorly about the data science career path. There are different career options in data science. You will know how attending a one-week duration bootcamps on data science will help you more over a 3 years’ degree. The courses are intended to make the student job ready and be equipped with the skills necessary for becoming a Data Scientist.
-
In this session we learn about the importance and introduction for Data Science. In this video we will also talk about the different technologies in data science and strong foundations of R programming language. We will also see the jobs in data science and the types of jobs in data science. Furthermore, we will see prerequisites for data science and difference between BI and Data Science.
-
In this lecture about how to learn data science with a step by step explanation. This video will talk about the career path in data science specially from a fresher’s point of view. Further we will talk about the skills required to become a successful data scientist and also about the compensation of a data scientist. Lastly we will see the platforms and data science tools used to learn data science. This video also clarifies whether a person would need a degree for a successful career in data science.
After the completion of this course, you will be able to:
a).Explain how these results can be used to solve business problems.
b).Use mathematics, statistics, and the scientific method to solve problems
c).Evaluate and prepare data using a variety of tools and techniques, including SQL, data mining, and data integration approaches.
d).Use predictive analytics, such as machine learning and deep learning models, to extract insights from data.
e).Create data-processing and calculation-automation apps.
This course is designed to equip participants with the essential skills and knowledge needed to launch a successful career in data science. It covers fundamental concepts, tools, and techniques, along with practical applications and project work.
Week 1: Introduction to Data Science
a).What is Data Science?
b).Overview of the data science lifecycle
c).Key roles in data science: Data Scientist, Data Analyst, Data Engineer
d).Tools and technologies in data science
Week 2: Data Fundamentals
a).Types of data: Structured vs. Unstructured
b).Data collection methods
c).Data cleaning and preprocessing
d).Introduction to data visualization
Week 3: Statistics for Data Science
a).Descriptive statistics: Mean, median, mode, variance
b).Probability theory and distributions
c).Inferential statistics: Hypothesis testing, confidence intervals
d).Introduction to regression analysis
Week 4: Programming for Data Science
a).Introduction to Python (or R)
b).Libraries for data science: NumPy, pandas, Matplotlib, Seaborn
c).Basic programming concepts: Data types, control structures, functions
d).Hands-on exercises: Data manipulation and visualization
Week 5: Data Visualization Techniques
a).Importance of data visualization
b).Tools: Matplotlib, Seaborn, Tableau, or Power BI
c).Creating effective visualizations: Charts, graphs, dashboards
d).Project: Visualizing a dataset of choice
Week 6: Machine Learning Basics
a).Introduction to machine learning concepts
b).Supervised vs. unsupervised learning
c).Key algorithms: Linear regression, decision trees, k-means clustering
d).Hands-on with Scikit-learn
Week 7: Advanced Machine Learning Techniques
a).Model evaluation metrics: Accuracy, precision, recall, F1-score
b).Overfitting and underfitting
c).Ensemble methods: Random forests, boosting
d).Introduction to neural networks
Week 8: Big Data Technologies
a).Overview of big data concepts
b).Introduction to Hadoop and Spark
c).Working with large datasets: NoSQL databases
d).Hands-on project: Analyzing a big data set
Week 9: Real-World Applications of Data Science
a).Case studies in various industries (healthcare, finance, marketing)
b).Ethics in data science: Bias, privacy, and security
c).Communicating results effectively to stakeholders
Week 10: Building a Data Science Portfolio
a).Importance of a portfolio
b).Projects to include in your portfolio
c).Best practices for presenting your work
d).Tips for job hunting in data science
Recommended Resources:
1).Textbooks:
a)."Python for Data Analysis" by Wes McKinney
b)."Hands-On Machine Learning with Scikit-Learn, Keras, and TensorFlow" by Aurélien Géron
2).Online Courses:
a).Coursera, edX, or Udacity for supplemental learning
3).Tools:
a).Jupyter Notebook, Google Colab, Tableau
4).Assessment:
a).Weekly quizzes and assignments
b).Mid-term project
c).Final capstone project showcasing data science skills
Data science Certification consists of 80 multiple choice questions which you need to complete in 240 minutes of time. Data science has released exams based on the latest version of data science.
Data science continues to evolve as one of the most promising and in-demand career paths for skilled professionals. Today, successful data professionals understand that they must advance past the traditional skills of analyzing large amounts of data, data mining, and programming skills. In order to uncover useful intelligence for their organizations, data scientists must master the full spectrum of the data science life cycle and possess a level of flexibility and understanding to maximize returns at each phase of the process.
The professionals and graduates want to excel in their chosen areas. It is also well suited for those who are already working and would like to take certification for further career progression.
Uplatz online training guarantees the participants to successfully go through the Data Science certification provided by Uplatz. Uplatz provides appropriate teaching and expertise training to equip the participants for implementing the learnt concepts in an organization.
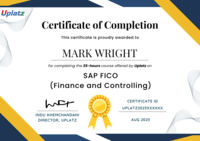
Course Completion Certificate will be awarded by Uplatz upon successful completion of the Data Science online course.
The Data scientist draws an average salary of $150,080 per year depending on the knowledge and hands-on experience. The Data scientist job roles are in high demand and make a rewarding career.
A data scientist is someone who makes value out of data. Such a person proactively fetches information from various sources and analyzes it for better understanding about how the business performs, and to build AI tools that automate certain processes within the company.
Note that salaries are generally higher at large companies rather than small ones. Your salary will also differ based on the market you work in.
The following are the job titles:
1. Data Scientist.
2. Data analyst.
3. Data engineers.
Q1.What does one understand by the term Data Science?
Ans-An interdisciplinary field that constitutes various scientific processes, algorithms, tools, and machine learning techniques working to help find common patterns and gather sensible insights from the given raw input data using statistical and mathematical analysis is called Data Science.
The following figure represents the life cycle of data science.
a).It starts with gathering the business requirements and relevant data.
b).Once the data is acquired, it is maintained by performing data cleaning, data warehousing, data staging, and data architecture.
c).Data processing does the task of exploring the data, mining it, analyzing it which can be finally used to generate the summary of the insights extracted from the data.
d).Once the exploratory steps are completed, the cleansed data is subjected to various algorithms like predictive analysis, regression, text mining, recognition patterns, etc depending on the requirements.
e).In the final stage, the results are communicated to the business in a visually appealing manner. This is where the skill of data visualization, reporting, and different business intelligence tools come into the picture.
Q2.What is the difference between data analytics and data science?
Ans-
a).Data science involves the task of transforming data by using various technical analysis methods to extract meaningful insights using which a data analyst can apply to their business scenarios.
b).Data analytics deals with checking the existing hypothesis and information and answers questions for a better and effective business-related decision-making process.
c).Data Science drives innovation by answering questions that build connections and answers for futuristic problems. Data analytics focuses on getting present meaning from existing historical context whereas data science focuses on predictive modeling.
d).Data Science can be considered as a broad subject that makes use of various mathematical and scientific tools and algorithms for solving complex problems whereas data analytics can be considered as a specific field dealing with specific concentrated problems using fewer tools of statistics and visualization.
Q3.What are some of the techniques used for sampling? What is the main advantage of sampling?
Ans-Data analysis can not be done on a whole volume of data at a time especially when it involves larger datasets. It becomes crucial to take some data samples that can be used for representing the whole population and then perform analysis on it. While doing this, it is very much necessary to carefully take sample data out of the huge data that truly represents the entire dataset.
There are majorly two categories of sampling techniques based on the usage of statistics, they are:
a).Probability Sampling techniques: Clustered sampling, Simple random sampling, Stratified sampling.
b).Non-Probability Sampling techniques: Quota sampling, Convenience sampling, snowball sampling, etc.
Q4.List down the conditions for Overfitting and Underfitting.
Ans-
a).Overfitting: The model performs well only for the sample training data. If any new data is given as input to the model, it fails to provide any result. These conditions occur due to low bias and high variance in the model. Decision trees are more prone to overfitting.
b).Underfitting: Here, the model is so simple that it is not able to identify the correct relationship in the data, and hence it does not perform well even on the test data. This can happen due to high bias and low variance. Linear regression is more prone to Underfitting.
Q5. What are Eigenvectors and Eigenvalues?
Ans-Eigenvectors are column vectors or unit vectors whose length/magnitude is equal to 1. They are also called right vectors. Eigenvalues are coefficients that are applied on eigenvectors which give these vectors different values for length or magnitude.
A matrix can be decomposed into Eigenvectors and Eigenvalues and this process is called Eigen decomposition. These are then eventually used in machine learning methods like PCA (Principal Component Analysis) for gathering valuable insights from the given matrix.
Q6.What does it mean when the p-values are high and low?
Ans-A p-value is the measure of the probability of having results equal to or more than the results achieved under a specific hypothesis assuming that the null hypothesis is correct. This represents the probability that the observed difference occurred randomly by chance.
a).Low p-value which means values ≤ 0.05 means that the null hypothesis can be rejected and the data is unlikely with true null.
b).High p-value, i.e values ≥ 0.05 indicates the strength in favor of the null hypothesis. It means that the data is like with true null.
c).p-value = 0.05 means that the hypothesis can go either way.
Q7. When is resampling done?
Ans-Resampling is a methodology used to sample data for improving accuracy and quantify the uncertainty of population parameters. It is done to ensure the model is good enough by training the model on different patterns of a dataset to ensure variations are handled. It is also done in the cases where models need to be validated using random subsets or when substituting labels on data points while performing tests.8. What do you understand by Imbalanced Data?Data is said to be highly imbalanced if it is distributed unequally across different categories. These datasets result in an error in model performance and result in inaccuracy.9. Are there any differences between the expected value and mean value?
There are not many differences between these two, but it is to be noted that these are used in different contexts. The mean value generally refers to the probability distribution whereas the expected value is referred to in the contexts involving random variables.
Q8.What do you understand by Survivorship Bias?
Ans-This bias refers to the logical error while focusing on aspects that survived some process and overlooking those that did not work due to lack of prominence. This bias can lead to deriving wrong conclusions.
Q9. Define the terms KPI, lift, model fitting, robustness and DOE.
Ans-
a).KPI: KPI stands for Key Performance Indicator that measures how well the business achieves its objectives.
b).Lift: This is a performance measure of the target model measured against a random choice model. Lift indicates how good the model is at prediction versus if there was no model.
c).Model fitting: This indicates how well the model under consideration fits given observations.
d).Robustness: This represents the system’s capability to handle differences and variances effectively.
e).DOE: stands for the design of experiments, which represents the task design aiming to describe and explain information variation under hypothesized conditions to reflect variables.
Q10.Define confounding variables.
Ans-Confounding variables are also known as confounders. These variables are a type of extraneous variables that influence both independent and dependent variables causing spurious association and mathematical relationships between those variables that are associated but are not casually related to each other.
Q11.How are the time series problems different from other regression problems?
Ans-
a).Time series data can be thought of as an extension to linear regression which uses terms like autocorrelation, movement of averages for summarizing historical data of y-axis variables for predicting a better future.
b).Forecasting and prediction is the main goal of time series problems where accurate predictions can be made but sometimes the underlying reasons might not be known.
c).Having Time in the problem does not necessarily mean it becomes a time series problem. There should be a relationship between target and time for a problem to become a time series problem.
d).The observations close to one another in time are expected to be similar to the ones far away which provide accountability for seasonality. For instance, today’s weather would be similar to tomorrow’s weather but not similar to weather from 4 months from today. Hence, weather prediction based on past data becomes a time series problem.
Q12.Suppose there is a dataset having variables with missing values of more than 30%, how will you deal with such a dataset?
Ans-Depending on the size of the dataset, we follow the below ways:
a).In case the datasets are small, the missing values are substituted with the mean or average of the remaining data. In pandas, this can be done by using mean = df.mean() where df represents the pandas dataframe representing the dataset and mean() calculates the mean of the data. To substitute the missing values with the calculated mean, we can use df.fillna(mean).
b) For larger datasets, the rows with missing values can be removed and the remaining data can be used for data prediction.
Q13.What is Cross-Validation?
Ans-Cross-Validation is a Statistical technique used for improving a model’s performance. Here, the model will be trained and tested with rotation using different samples of the training dataset to ensure that the model performs well for unknown data. The training data will be split into various groups and the model is run and validated against these groups in rotation.


