Bundle Course - Microsoft 365 & Power User Professional
Master Microsoft 365 Apps and Tools – Excel, Power BI, Project, and Office Apps for Enhanced Productivity and Data InsightsPreview Bundle Course - Microsoft 365 & Power User Professional course
Price Match Guarantee Full Lifetime Access Access on any Device Technical Support Secure Checkout Course Completion Certificate 93% Started a new career
BUY THIS COURSE (
93% Started a new career
BUY THIS COURSE (GBP 27 GBP 49 )-
 81% Got a pay increase and promotion
Students also bought -
-

- Microsoft 365 (beginner to expert)
- 51 Hours
- GBP 12
- 470 Learners
-

- Power BI
- 5 Hours
- GBP 12
- 55 Learners
-

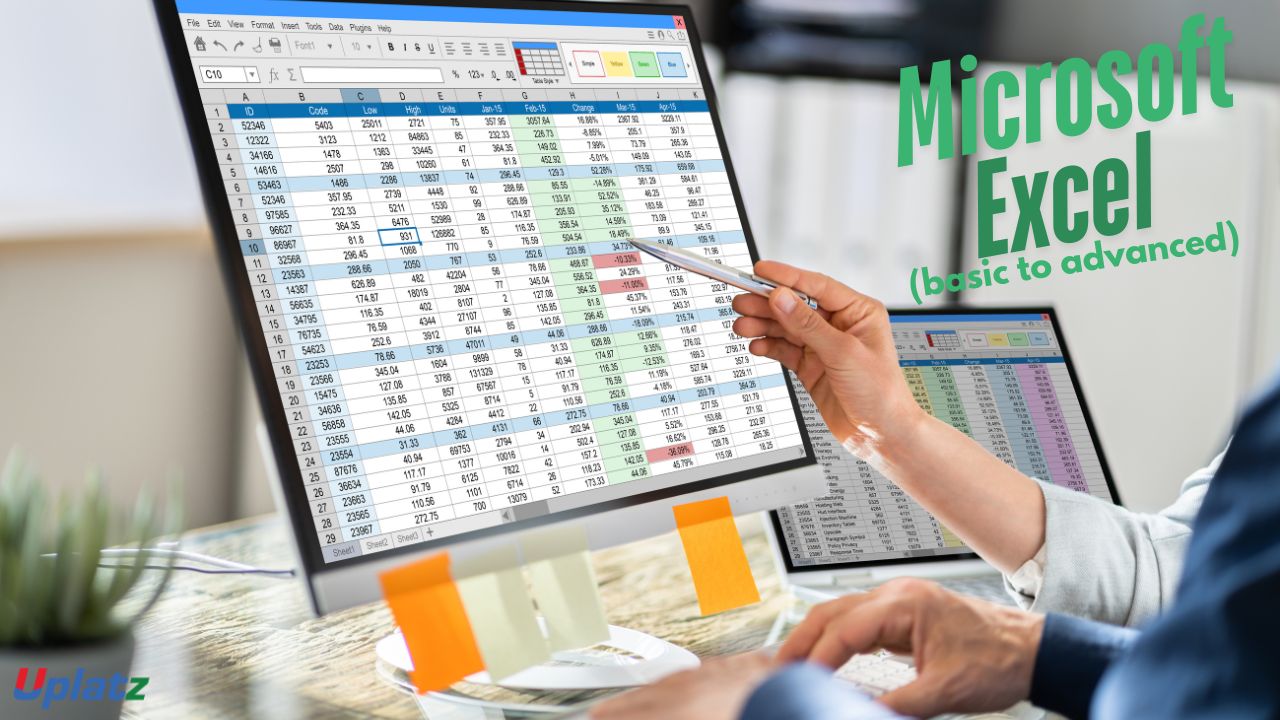
- Microsoft Excel (basic to advanced)
- 35 Hours
- GBP 12
- 1743 Learners

- Microsoft 365 Beginner to Expert
- Microsoft Excel Beginner to Expert
- Microsoft Project (Basic to Advanced)
- Microsoft Power BI
Start with Microsoft 365 Beginner to Expert to understand the full suite including Word, Excel, Outlook, Teams, SharePoint, and OneDrive. Then deep-dive into Excel for data analysis, pivot tables, advanced formulas, and dashboards. Follow it up with Microsoft Project for planning and tracking business and IT projects. Conclude with Power BI to master interactive dashboard creation and business intelligence.
- Navigate and collaborate using Microsoft 365 cloud apps
- Use Teams, SharePoint, OneDrive, and Outlook for productivity
- Create dynamic spreadsheets and dashboards in Excel
- Automate tasks using Excel formulas and Power Query
- Plan, schedule, and track projects using Microsoft Project
- Build compelling business reports and dashboards using Power BI
- Analyze trends, KPIs, and performance metrics with visual insights
- Integrate Excel and Power BI for real-time data updates
- Leverage Microsoft 365 tools for team communication and file management
- Prepare for Microsoft certifications and real-world productivity roles
-
Office Professionals and Power Users
-
Project Managers and Team Leaders
-
Business Analysts and Reporting Specialists
-
Excel Users aiming to upskill to Power BI and automation
-
Microsoft 365 Administrators and End Users
-
Entrepreneurs and Startup Teams using Microsoft 365
Course/Topic 1 - Course access through Google Drive
-
Google Drive
-
Google Drive
Course/Topic 2 - Microsoft Excel - all lectures
-
Lecture 1 - Introduction to Microsoft Excel
-
Lecture 2 - Key in Data
-
Lecture 3 - Font and Alignment
-
Lecture 4 - Cut Paste and Format Painter
-
Lecture 5 - Control plus Keys
-
Lecture 6 - Home Commands and Clipboard
-
Lecture 7 - File Tab
-
Lecture 8 - Sorting and Filtering
-
Lecture 9.1 - Basic Formulas
-
Lecture 9.2 - Text Formulas
-
Lecture 10.1 - VLookup - part 1
-
Lecture 10.2 - VLookup - part 2
-
Lecture 10.3 - HLookup
-
Lecture 10.4 - This is a bonus session on Vlookup from a different tutor
-
Lecture 10.5 - This is a bonus session on Vlookup from a different tutor
-
Lecture 11.1 - Pivot Tables - part 1
-
Lecture 11.2 - Pivot Tables - part 2
-
Lecture 11.3 - Pivot Tables - part 3
-
Lecture 11.4 - Pivot Tables - part 4
-
Lecture 12.1 - Charts - part 1
-
Lecture 12.2 - Charts - part 2
-
Lecture 12.3 - Column Charts
-
Lecture 12.4 - Bar Charts
-
Lecture 12.5 - Line Charts
Course/Topic 3 - Microsoft Project (basic to advanced) - all lectures
-
Lecture 1 - Overview of Microsoft Project
-
Lecture 2 - The Stage
-
Lecture 3 - The Back Stage
-
Lecture 4 - Views and Tables in MSP
-
Lecture 5 - Project Initiation - part 1
-
Lecture 6 - Project Initiation - part 2
-
Lecture 7 - Tasks and Milestones
-
Lecture 8 - Linking Tasks
-
Lecture 9 - More on Linking Tasks
-
Lecture 10 - Creating Resources
-
Lecture 11 - Creating Resources - advanced
-
Lecture 12 - Assigning Resources
-
Lecture 13 - Applying Cost Tables
-
Lecture 14 - Units Work Duration
-
Lecture 15 - Handy Features - revised
-
Lecture 16 - Critical Path Identification
-
Lecture 17 - Resource Leveling
-
Lecture 18 - Baselining
-
Lecture 19 - Updating Project - part 1
-
Lecture 20 - Updating Project - part 2
-
Lecture 21 - Updating Project - part 3
-
Lecture 22 - Monitoring
-
Lecture 23 - Controlling - part 1
-
Lecture 24 - Controlling - part 2
-
Lecture 25 - Reports Pack
-
Lecture 26 - Support EVM
-
Master core Microsoft 365 tools including Outlook, Word, Teams, and SharePoint
-
Use Excel to perform data analysis, modeling, and reporting tasks
-
Build interactive dashboards and reports in Power BI
-
Manage complex projects using Microsoft Project
-
Understand data import, cleaning, and transformation processes
-
Automate repetitive Excel tasks with advanced formulas and macros
-
Collaborate effectively using Teams and shared workspaces
-
Develop and visualize KPIs and business metrics
-
Understand how to connect, model, and analyze data across tools
-
Prepare for industry-relevant roles and certifications in Microsoft technologies
- Introduction to Microsoft 365 ecosystem
- Word, Excel, PowerPoint, and Outlook basics
- Microsoft Teams: chat, channels, meetings, and collaboration
- OneDrive and SharePoint for document sharing and version control
- Forms, Planner, and To Do
- Security, file management, and cloud storage
- Integrations and workflows in Microsoft 365
- Excel interface, formatting, and formulas
- Conditional formatting and data validation
- Lookup functions (VLOOKUP, INDEX-MATCH)
- PivotTables and PivotCharts
- Power Query and Power Pivot
- Dashboard creation using charts, slicers, and dynamic ranges
- Macros and basic VBA for automation
- Project setup and workspace
- Work Breakdown Structure (WBS)
- Task dependencies, milestones, and critical path
- Resource allocation and workload leveling
- Cost tracking and baseline comparison
- Project tracking and earned value analysis
- Reporting and Gantt chart customizations
-
Power BI Desktop and Service overview
-
Data connection and transformation using Power Query
-
Data modeling and DAX formulas
-
Report design: cards, tables, maps, charts, KPIs
-
Interactive dashboards and slicers
-
Power BI publishing and sharing
-
Row-level security and report automation
- Microsoft 365 Certified: Fundamentals (MS-900)
- Microsoft Excel Expert
- Microsoft Power BI Data Analyst (PL-300)
- Microsoft Project Certification (MPUG or PMI-aligned)
- Microsoft 365 Power User
- Excel Specialist / Analyst
- Project Coordinator / Project Manager
- Business Intelligence Analyst
- Power BI Developer
- Office 365 Support Consultant
OneDrive is for personal file storage, while SharePoint is used for team collaboration, document libraries, and shared workspaces.
It automatically formats cells based on rules like cell value, formulas, or duplicates to highlight key data trends.
WBS breaks down the overall project into smaller tasks and sub-tasks for better planning and tracking.
DAX (Data Analysis Expressions) is a formula language used to define calculated columns, measures, and custom aggregations in Power BI.
Tasks can be automated using macros, formulas, Power Query, or basic VBA scripting.
Teams meetings, chats, and notifications can be scheduled and accessed directly from Outlook’s calendar and mail interface.
Slicers are interactive filters that allow users to segment data dynamically within dashboards.
The critical path includes all tasks that directly impact the project’s finish date and must be monitored closely to avoid delays.
You can publish to the Power BI Service and share it with users in your organization with access controls and RLS (Row-Level Security).
Power Query is used for importing and transforming data, while Power Pivot is used for creating complex data models and relationships.


