


( 816 Students )


Business Intelligence and Data Analytics
Learn about data analytics, science, business analytics, machine learning, artificial intelligence, and business applications.Preview Business Intelligence and Data Analytics course
Price Match Guarantee Full Lifetime Access Access on any Device Technical Support Secure Checkout Course Completion Certificate 93% Started a new career
BUY THIS COURSE (
93% Started a new career
BUY THIS COURSE (GBP 10 GBP 29 )-
 96% Got a pay increase and promotion
Students also bought -
-
- Bundle Course - Data Visualization with Python and R
- 35 Hours
- GBP 15
- 1858 Learners
-
- Bundle Course - Data Analytics
- 250 Hours
- GBP 15
- 803 Learners
-
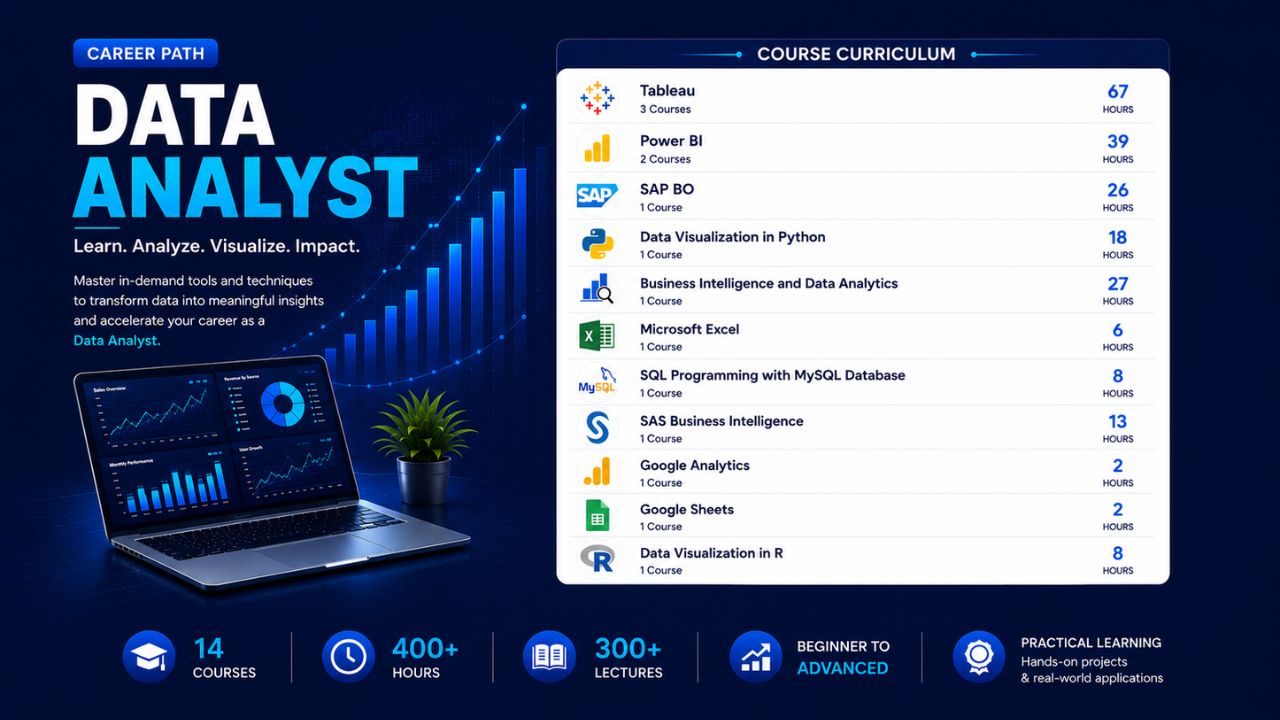
- Career Path - Data Analyst
- 400 Hours
- GBP 32
- 6488 Learners

Business Intelligence is a combination of methods, procedures, and technology that assist corporations, business managers, and other end users in making better business choices. Business intelligence refers to the use of data to manage a company's day-to-day operations. When leaders want to gather and save data regarding current operations, maximize workflow, provide insightful reports, and meet their current business goals, they turn to business intelligence tools and specialists. Business analytics is a more statistically driven area in which data analysts utilize quantitative techniques to create forecasts and design future growth plans. Some experts use business analytics as a term to describe a set of predictive tools used within the realm of business intelligence.
The rise has been enormous, and it has provided a plethora of chances for people interested in working as business intelligence analysts. With the passage of time, business duties get more sophisticated, leaving less time for research and development. Large corporations are rushing to win the competition, which necessitates a thorough comprehension of topics. However, as the amount of chaotic data grows, real-time analysis becomes increasingly difficult. That is the moment at which businesses want technology that allow them to quickly assess and forecast market trends, and BI fulfils this requirement.
We are continually attempting to develop innovative educational techniques here. Our Business Intelligence and Analytics courseware includes Microsoft Power BI, Board BI Platform, Data Warehousing and BI, and other key and necessary topics. We provide Business Intelligence and Analytics training to assist professionals in staying ahead of the competition. We believe in high-quality instruction; therefore, participants will be mentored by industry professionals throughout the course. Participants will get lifelong access to our specialists as part of the post-training assistance.
Uplatz provides this Business Intelligence and Analytics course aiming at business professionals, and teaches them the fundamentals of data analytics, science and business analytics. The curriculum is designed to maximise learning while causing the least amount of disturbance to professional commitments. This is a career-enhancing curriculum that teaches data management, programming, statistics, machine learning, artificial intelligence, and business applications in a rigorous theoretical and practical manner.
Learn job-ready skills that are in demand, like how to analyze and process data to gain key business insights. This Busienss Intelligence and Data Analytics course addresses methods for managing and analyzing large datasets. Start your career as a data scientist by studying data mining, big data applications, and data product development.
Course/Topic - Business Intelligence and Data Analytics - all lectures
-
In this lecture session we discuss about Bi concepts, examples and application of business intelligence and data analytics and also cover other concepts of BI.
-
In this lecture session we learn about basic concepts of BI and also cover factors of business intelligence in brief.
-
In this lecture session we learn about data warehouse data access and data dashboarding and also cover presentation in BI.
-
In this lecture session we learn about product database, advertise database and customer demographic database and also cover data analyst concepts.
-
In this lecture session we learn about basic introduction of business intelligence and also cover factors of business intelligence in brief.
-
In this lecture session we learn about introduction of predictive modeling and also cover functions of predictive modeling in brief.
-
In this lecture session we learn about data related to customer services and also talk about customer relation databases in brief.
-
In this lecture session we learn about introduction of NoSQL and also cover basic functions of NoSQL in business intelligence.
-
In this lecture session we learn about graph stores and also talk about the advantages and disadvantages of graph stores in BI.
-
In this lecture session we learn about hierarchical clustering in business intelligence and also talk about clustering factors in BI.
-
In this lecture session we learn about introduction of salesforce in business intelligence and also talk about some basic uses of salesforce.
-
In this lecture session we learn about introduction to NLP and also cover what is natural language processing in artificial intelligence.
-
In this lecture session we learn about natural language processing speech to text conversion and also cover the importance of natural language processing.
-
In this lecture session we learn about introduction of apache server in business intelligence and also talk about basics of apache server.
-
In this lecture session we learn about deep drive into business intelligence and also talk about factors or deep drive in business intelligence.
-
In this lecture session we learn about data warehousing in business intelligence and data analytics and also talk about factors and features of data warehousing.
-
In this lecture session we learn about types of data in business intelligence and also talk about different types of data in BI.
-
In this lecture session we learn about mobile BI and also talk about open source BI software replacing vendor offering.
-
In this lecture session we learn about real time BI in business intelligence and also talk about factors of real time BI in brief.
-
In this lecture session we learn about data analytics comprehensively and also talk about functions of data analytics.
-
In this lecture session we talk about data analytics vs business analytics and also talk about the importance of data analytics.
-
In this lecture session we learn about Embedded analytics and also talk about functions of Embedded analytics in data analytics.
-
In this lecture session we learn about collection analytics and also cover the importance of collection analytics.
-
In this lecture session we learn about survival analytics and also cover duration analytics in brief.
-
In this lecture session we learn about machine learning techniques and also cover the importance and factors of machine learning techniques in business intelligence.
-
In this lecture session we learn about geospatial predictive analytics and also talk about functions of geospatial predictive analytics in business intelligence.
-
In this lecture session we learn about cohort analysis in data analyst and we also cover functions and importance of cohort analysis.
-
In this lecture session we learn about data mining in business intelligence and also talk about data mining functions and why we need data mining in business intelligence.
-
In these lecture sessions we learn about anomaly detection and also talk about functions of anomaly detection in brief.
-
In these lecture sessions we learn about statistically sound association and also talk about factors of statistically sound association in business intelligence.
-
In this lecture session we learn about cluster analysis. We’ll cover all types of cluster analysis in brief and also cover the importance of cluster analysis in business analysis.
-
In this lecture session we learn about DBSCAN in business intelligence and also talk about DBSCAN functions and importance.
-
In this lecture session we learn about regression models in business intelligence and also talk about the function of regression models.
-
In this lecture session we learn about extraction based summarization in business intelligence and also cover all types of summarization in data analyst.
-
In this lecture session we learn about machine learning in BI and also talk about factors and importance of machine learning in brief.
-
In this lecture session we learn about machine learning vs BI we also discuss the basic difference between machine learning and business intelligence.
-
In this lecture session we learn about how ml can make BI better and also talk about ml basic functions.
-
In this lecture session we learn about data warehousing and also talk about how we manage data warehousing in business intelligence.
-
In this lecture session we learn about data warehousing in business intelligence and data analytics and also talk about factors and features of data warehousing.
-
In this lecture session we learn about data mart in business intelligence and also talk about data mart function.
-
In this lecture session we learn about data dimensions in business intelligence and also cover all types of data dimension in BI.
-
In this lecture session we learn about data dimension in business intelligence and also cover functions and importance of data dimension.
-
In this lecture session we learn about data vault modeling in business intelligence and also cover different types of vault modeling in brief.
-
In this lecture session we learn about links and satellites and also cover the importance and factors of links and satellites in business intelligence.
a).Learn the lingo of data, data analysis, and data science
b).To make better decisions, interpret data
c).With essential data analysis abilities, you can drive strategy and innovation
d).Learn about new technologies like blockchain, neural networks, and artificial intelligence
e).Learn by putting what you've learned into practise
f).To help you make better business decisions, interpret data
g).Recognize patterns, look for outliers, and compile data sets
h).Examine the connections between variables
i).Hypotheses should be developed and tested
j).Create good survey questions and make conclusions based on population samples
k).Excel may be used to do regression analysis and other analytical procedures
This course provides an in-depth understanding of Business Intelligence (BI) and Data Analytics. Participants will learn how to gather, analyze, and visualize data to support business decision-making and strategy formulation.
Part 1: Introduction to Business Intelligence
Week 1: Introduction to Business Intelligence
a) Definition and importance of Business Intelligence
b) Key components of BI: Data warehousing, ETL processes, and reporting
c) Overview of the BI lifecycle
d) Hands-on Exercise: Exploring BI tools and dashboards
Week 2: Data Warehousing Concepts
a) Understanding data warehousing architecture
b) Introduction to ETL (Extract, Transform, Load) processes
c) Data modeling techniques: Star schema, snowflake schema
d) Hands-on Exercise: Designing a simple data warehouse schema
Part 2: Data Analytics Fundamentals
Week 3: Introduction to Data Analytics
a) Types of data analytics: Descriptive, diagnostic, predictive, prescriptive
b) The role of data analytics in business decision-making
c) Tools and technologies for data analytics
d) Group Activity: Case study on analytics applications in business
Week 4: Data Collection and Preparation
a) Data collection methods: Surveys, web scraping, databases
b) Data cleaning and preprocessing techniques
c) Handling missing data and outliers
d) Hands-on Exercise: Cleaning and preparing a dataset for analysis
Part 3: Data Visualization
Week 5: Principles of Data Visualization
a) Importance of data visualization in BI
b) Key visualization techniques and best practices
c) Choosing the right charts and graphs for data representation
d) Hands-on Exercise: Creating visualizations using Excel or Tableau
Week 6: Advanced Data Visualization Techniques
a) Introduction to tools: Tableau, Power BI, or Google Data Studio
b) Building interactive dashboards and reports
c) Storytelling with data: Presenting insights effectively
d) Hands-on Exercise: Developing an interactive dashboard
Part 4: Predictive Analytics
Week 7: Introduction to Predictive Analytics
a) Understanding predictive modeling concepts
b) Common algorithms: Regression, decision trees, clustering
c) Overview of machine learning in predictive analytics
d) Hands-on Exercise: Implementing a basic predictive model using Python or R
Week 8: Model Evaluation and Validation
a) Techniques for model evaluation: Accuracy, precision, recall, F1 score
b) Cross-validation and hyperparameter tuning
c) Interpreting model results and making data-driven decisions
d) Hands-on Exercise: Evaluating a predictive model
Part 5: Advanced Topics in BI and Analytics
Week 9: Big Data and BI
a) Introduction to Big Data concepts and technologies (Hadoop, Spark)
b) The impact of Big Data on business intelligence
c) Strategies for integrating Big Data into BI systems
d) Group Discussion: Exploring real-world Big Data applications
Week 10: Emerging Trends in Business Intelligence
a) AI and machine learning in BI
b) The role of cloud computing in BI solutions
c) Data governance and ethical considerations
d) Group Activity: Research and present on a current trend in BI
Part 6: Capstone Project
Week 11: Capstone Project Preparation
a) Overview of capstone project objectives
b) Defining project scope: BI and data analytics application
c) Initial project planning and outlining tasks
d) Group Discussion: Feedback on project ideas
Week 12: Capstone Project Execution
a) Implementing the project using skills learned throughout the course
b) Presenting findings and solutions to the class
c) Peer reviews and discussions on project experiences
Recommended Resources:
Textbooks:
a)"Business Intelligence: A Managerial Approach" by Ramesh Sharda
b)"Data Analytics for Business" by G. Peter Zhang
Online Resources:
a).Coursera and edX for specialized courses
b).Blogs and forums on BI and data analytics
Tools:-Tableau, Power BI, Excel, R, Python, and SQL for hands-on practice
Assessment:
1).Weekly quizzes and assignments
2).Mid-term project focused on data preparation and visualization
3).Final capstone project showcasing a comprehensive BI and data analytics solution
The Business Intelligence and Data AnalyticsCertification ensures you know planning, production and measurement techniques needed to stand out from the competition.Business Intelligence refers to the information required to enhance business decision-making activities. Data Analytics refers to modifying the raw data into a meaningful format. The prime purpose of business intelligence is to provide support in decision making and help the organizations to grow their business.
Business intelligence (BI) and its subsets—business analytics and data analytics—are all data management solutions used to understand historical and contemporary data and create insights.The primary distinction between business intelligence and business analytics is the focus on when events occur. Business intelligence is focused on current and past events that are captured in the data. Business analytics is focused on what's most likely to happen in the future.
Uplatz online training guarantees the participants to successfully go through the Business Intelligence and Data Analyticscertification provided by Uplatz. Uplatz provides appropriate teaching and expertise training to equip the participants for implementing the learnt concepts in an organization.
Course Completion Certificate will be awarded by Uplatz upon successful completion of the Business Intelligence and Data Analyticsonline course.
The Business Intelligence and Data Analytics draws an average salary of $110.952 per year depending on their knowledge and hands-on experience. The Business Intelligence and Data Analytics Admin job roles are in high demand and make a rewarding career.
Pursuing a position within Business Intelligence presents many opportunities for a satisfying and exciting career. BI consultants are essential for decision making on all levels within companies and are highly valued by senior stakeholders.
Attractive paychecks: BI professionals are in high demand withdrawing attractive salaries every month. According to a recent survey, the average salary of Business Intelligence Analysts in the US is supposed to rise 4.3 percent in the future, ranging from $118,000 to $171,750 per annum.
The business intelligence industry has expanded exponentially in recent years and is expected to continue growing. If you want to make the most of data analysis in an established or newly adopted BI system, your team should be data-driven.
Note that salaries are generally higher at large companies rather than small ones. Your salary will also differ based on the market you work in.
1).Business Intelligence/ Business Analyst.
2).Business Intelligence Analyst.
3).Senior Quantitative Analytics Specialist.
Q1. What is Business Intelligence?
Answer:The term ‘Business Intelligence’ (BI) provided the user with data and tools to answer any decision making the important question of an organization; it can be related to run the business or part of a business. In short, business intelligence is used for reporting the specified data of any business, which is very important and using which higher management of any organization will make the decision for the growth of their business. Normally below decisions can be decided by any organization from the Business Intelligence tool
1).BI is used to determine whether a business is running as per plan.
2).BI is used to identify which things are actually going wrong.
3).BI is used to take and monitor corrective actions.
4). BI is used to identify the current trends of their business.
Q2.What are the different stages and benefits of Business Intelligence?
Answer:There are the following five stages of Business Intelligence:
1).Data Source: It is about extracting data from multiple data source.
2).Data Analysis: It is about providing a proper analysis report based on useful knowledge from collecting data.
3).Decision-Making Support: It is about to properly using the information. It always targets to provide a proper graph on important events like take over, market changes, and poor staff performance.
4).Situation Awareness: It is about filtering out irrelevant information and setting the remaining information in the context of the business and its environment.
5).Risk Management: It is about to discover that what corrective actions might be taken or decisions made at different times.
Following are different benefits of Business Intelligence:
1).Improving decisions making.
2).Speed up on decision making.
3).Optimizing internal business process.
4).Increase operational efficiency.
5).Helping or driving for new revenues.
6).Gaining an advantage in terms of competitive markets with another close competitor.
Q3.What are different Business Intelligence tools available in the market?
Answer:There are a lot of intelligence tools available in the market, in between them, below are the most popular:
a.Oracle Business Intelligence Enterprise Edition (OBIEE)
b. Cognos
c. Microstrategy
d.SAS Business Intelligence
e.Business Object
f.Tableau
g.Microsoft Business Intelligence Tool
h.Oracle Hyperion System
Q4. What is the universe in Business Analytics?
Answer:The universe is a kind of semantic layer between the database and user interface. More correctly, it is one of the interfacing layers between the client (business user) and a data warehouse. It actually defines an entire relationship between various tables in a data warehouse.
Q5. Define or list the differences between OLAP and OLTP?
Answer:In general, we can assume OLTP is actually helping to provide source data in a data warehouse and OLAP help to analyze the same
|
OLTP System
|
OLAP System
|
|
|
Source of Data |
Operational data, OLTP are the original source of data. |
Consolidated data, OLAP data has come from various OLTP databases. |
|
Purpose of Data |
For any kind of current or fundamental business tasks. |
To help with future planning, problem-solving or decision making. |
|
Data Updating |
End users initiated data frequently insert or update in the transactional database. |
Data updated based on a batch job after one defined time interval. This time can be less or more than one day. |
|
Processing Speed |
As usual, typically very fast. |
Obviously depends on the amount of data. After refreshing batch data, sometimes complex queries are taken more than hours. Common habit to add an index to improve the speed. |
|
Space requirement |
Again relative small considering historical data in the archived state. |
Obviously larger as it has to hold all the historical data, the existence of aggregation structures also require more indexes than OLTP. |
|
Database Architecture |
Normalized data, so all the tables and data have a proper relationship. |
Typically de-normalize of few tables (like factor dimensions). It normally used a star or snowflake schema. |
|
Backup and Recovery |
Back-up is an essential requirement on OLTP, as it’s day-to-day data, so any data loss is likely to entail significant monetary loss and legal liability. |
Instead of regular backups, some environment may consider simply reloading the OLTP data as a recovery method. |
Q6. What is a dashboard in a data warehouse?
Answer:The dashboard is nothing but the arrangement of all the reports and graphs on one page. It is nothing but the collection of reports in a different format that has the same functionality display on the same page.
Q7. Explain the difference between data warehouse and transnational system.
Answer:
|
Transactional System |
Data Warehouse System |
|
It normally designed to process with day to day data, so it mainly concentrates on high volume transaction processing rather than backend reporting. |
It normally designed to processed high volume analytical reporting and subsequence. It is also elaborating report generation. |
|
It is normally processes driven, which means it depends on a business-specific task or execution. |
It is actually subject-oriented, which means it loads data from a transactional system, then open to use for any kind of analytical reporting, which helps the organisation make proper decisions based on that specific subject. |
|
It is normally handling current transactional data. |
It is normally handling historical data. |
|
Data within a transactional system can insert or update or delete in each task. |
Data warehouse data is called as non-volatile, meaning that new data can be added regularly, but once loaded, those data are rarely changed. |
|
In case of performance or speed, we should always prefer a transactional system for inserting, updating or deleting small volumes of data. |
We should always prefer a data warehouse to fast retrieval of a relatively large volume of data. |
Q8. Explain the Fact and Dimension table with an example.
Answer:A Fact table is the center table in the star schema of a data warehouse. It was actually holding quantitative information for analysis, and maximum time it de-normalized.
A dimension table is one of the important tables in a data warehouse’s star schema, which stores attribute, or dimension, that describe the objects in a fact table.The fact table mainly holds two types of columns. The foreign key column allows joins with dimension tables, and the major columns contain the data that is being analyzed.
Example: Suppose one company sells products to customers. So every sale will be one fact, so the fact table holds that information like below:
|
Time ID |
Product ID |
Customer ID |
Unit Sold |
|
4 |
17 |
2 |
1 |
|
8 |
<p class="MsoNormal" style="ms
Course Quiz Back to Top
FAQs
Back to Top
Q1. What are the payment options?
A1. We have multiple payment options:
1) Book your course on our webiste by clicking on Buy this course button on top right of this course page
2) Pay via Invoice using any credit or debit card
3) Pay to our UK or India bank account
4) If your HR or employer is making the payment, then we can send them an invoice to pay.
Q2. Will I get certificate?
A2. Yes, you will receive course completion certificate from Uplatz confirming that you have completed this course with Uplatz. Once you complete your learning please submit this for to request for your certificate https://training.uplatz.com/certificate-request.php
Q3. How long is the course access?
A3. All our video courses comes with lifetime access. Once you purchase a video course with Uplatz you have lifetime access to the course i.e. forever. You can access your course any time via our website and/or mobile app and learn at your own convenience.
Q4. Are the videos downloadable?
A4. Video courses cannot be downloaded, but you have lifetime access to any video course you purchase on our website. You will be able to play the videos on our our website and mobile app.
Q5. Do you take exam? Do I need to pass exam? How to book exam?
A5. We do not take exam as part of the our training programs whether it is video course or live online class. These courses are professional courses and are offered to upskill and move on in the career ladder. However if there is an associated exam to the subject you are learning with us then you need to contact the relevant examination authority for booking your exam.
Q6. Can I get study material with the course?
A6. The study material might or might not be available for this course. Please note that though we strive to provide you the best materials but we cannot guarantee the exact study material that is mentioned anywhere within the lecture videos. Please submit study material request using the form https://training.uplatz.com/study-material-request.php
Q7. What is your refund policy?
A7. Please refer to our Refund policy mentioned on our website, here is the link to Uplatz refund policy https://training.uplatz.com/refund-and-cancellation-policy.php
Q8. Do you provide any discounts?
A8. We run promotions and discounts from time to time, we suggest you to register on our website so you can receive our emails related to promotions and offers.
Q9. What are overview courses?
A9. Overview courses are 1-2 hours short to help you decide if you want to go for the full course on that particular subject. Uplatz overview courses are either free or minimally charged such as GBP 1 / USD 2 / EUR 2 / INR 100
Q10. What are individual courses?
A10. Individual courses are simply our video courses available on Uplatz website and app across more than 300 technologies. Each course varies in duration from 5 hours uptop 150 hours.
Check all our courses here https://training.uplatz.com/online-it-courses.php?search=individual
Q11. What are bundle courses?
A11. Bundle courses offered by Uplatz are combo of 2 or more video courses. We have Bundle up the similar technologies together in Bundles so offer you better value in pricing and give you an enhaced learning experience.
Check all Bundle courses here https://training.uplatz.com/online-it-courses.php?search=bundle
Q12. What are Career Path programs?
A12. Career Path programs are our comprehensive learning package of video course. These are combined in a way by keeping in mind the career you would like to aim after doing career path program. Career path programs ranges from 100 hours to 600 hours and covers wide variety of courses for you to become an expert on those technologies.
Check all Career Path Programs here https://training.uplatz.com/online-it-courses.php?career_path_courses=done
Q13. What are Learning Path programs?
A13. Learning Path programs are dedicated courses designed by SAP professionals to start and enhance their career in an SAP domain. It covers from basic to advance level of all courses across each business function. These programs are available across SAP finance, SAP Logistics, SAP HR, SAP succcessfactors, SAP Technical, SAP Sales, SAP S/4HANA and many more
Check all Learning path here https://training.uplatz.com/online-it-courses.php?learning_path_courses=done
Q14. What are Premium Career tracks?
A14. Premium Career tracks are programs consisting of video courses that lead to skills required by C-suite executives such as CEO, CTO, CFO, and so on. These programs will help you gain knowledge and acumen to become a senior management executive.
Q15. How unlimited subscription works?
A15. Uplatz offers 2 types of unlimited subscription, Monthly and Yearly.
Our monthly subscription give you unlimited access to our more than 300 video courses with 6000 hours of learning content. The plan renews each month. Minimum committment is for 1 year, you can cancel anytime after 1 year of enrolment.
Our yearly subscription gives you unlimited access to our more than 300 video courses with 6000 hours of learning content. The plan renews every year. Minimum committment is for 1 year, you can cancel the plan anytime after 1 year.
Check our monthly and yearly subscription here https://training.uplatz.com/online-it-courses.php?search=subscription
Q16. Do you provide software access with video course?
A16. Software access can be purchased seperately at an additional cost. The cost varies from course to course but is generally in between GBP 20 to GBP 40 per month.
Q17. Does your course guarantee a job?
A17. Our course is designed to provide you with a solid foundation in the subject and equip you with valuable skills. While the course is a significant step toward your career goals, its important to note that the job market can vary, and some positions might require additional certifications or experience.
Remember that the job landscape is constantly evolving. We encourage you to continue learning and stay updated on industry trends even after completing the course. Many successful professionals combine formal education with ongoing self-improvement to excel in their careers. We are here to support you in your journey!
Q18. Do you provide placement services?
A18. While our course is designed to provide you with a comprehensive understanding of the subject, we currently do not offer placement services as part of the course package. Our main focus is on delivering high-quality education and equipping you with essential skills in this field.
However, we understand that finding job opportunities is a crucial aspect of your career journey. We recommend exploring various avenues to enhance your job search:
a) Career Counseling: Seek guidance from career counselors who can provide personalized advice and help you tailor your job search strategy.
b) Networking: Attend industry events, workshops, and conferences to build connections with professionals in your field. Networking can often lead to job referrals and valuable insights.
c) Online Professional Network: Leverage platforms like LinkedIn, a reputable online professional network, to explore job opportunities that resonate with your skills and interests.
d) Online Job Platforms: Investigate prominent online job platforms in your region and submit applications for suitable positions considering both your prior experience and the newly acquired knowledge. e.g in UK the major job platforms are Reed, Indeed, CV library, Total Jobs, Linkedin.
While we may not offer placement services, we are here to support you in other ways. If you have any questions about the industry, job search strategies, or interview preparation, please dont hesitate to reach out. Remember that taking an active role in your job search process can lead to valuable experiences and opportunities.
Q19. How do I enrol in Uplatz video courses?
A19. To enroll, click on "Buy This Course," You will see this option at the top of the page.
a) Choose your payment method.
b) Stripe for any Credit or debit card from anywhere in the world.
c) PayPal for payments via PayPal account.
d) Choose PayUmoney if you are based in India.
e) Start learning: After payment, your course will be added to your profile in the student dashboard under "Video Courses".
Q20. How do I access my course after payment?
A20. Once you have made the payment on our website, you can access your course by clicking on the "My Courses" option in the main menu or by navigating to your profile, then the student dashboard, and finally selecting "Video Courses".
Q21. Can I get help from a tutor if I have doubts while learning from a video course?
A21. Tutor support is not available for our video course. If you believe you require assistance from a tutor, we recommend considering our live class option. Please contact our team for the most up-to-date availability. The pricing for live classes typically begins at USD 999 and may vary.
BUY THIS COURSE ( |