


( 679 Students )


Career Path - Business Intelligence Analyst
Master data analysis, reporting, and visualization to drive strategic business decisions.Preview Career Path - Business Intelligence Analyst course
Price Match Guarantee Full Lifetime Access Access on any Device Technical Support Secure Checkout Course Completion Certificate 92% Started a new career
BUY THIS COURSE (
92% Started a new career
BUY THIS COURSE (GBP 32 GBP 99 )-
 88% Got a pay increase and promotion
Students also bought -
-

- Business Intelligence Specialization
- 50 Hours
- GBP 10
- 718 Learners
-

- Career Accelerator - Head of Data, Analytics, and Machine Learning
- 200 Hours
- GBP 39
- 650 Learners
-
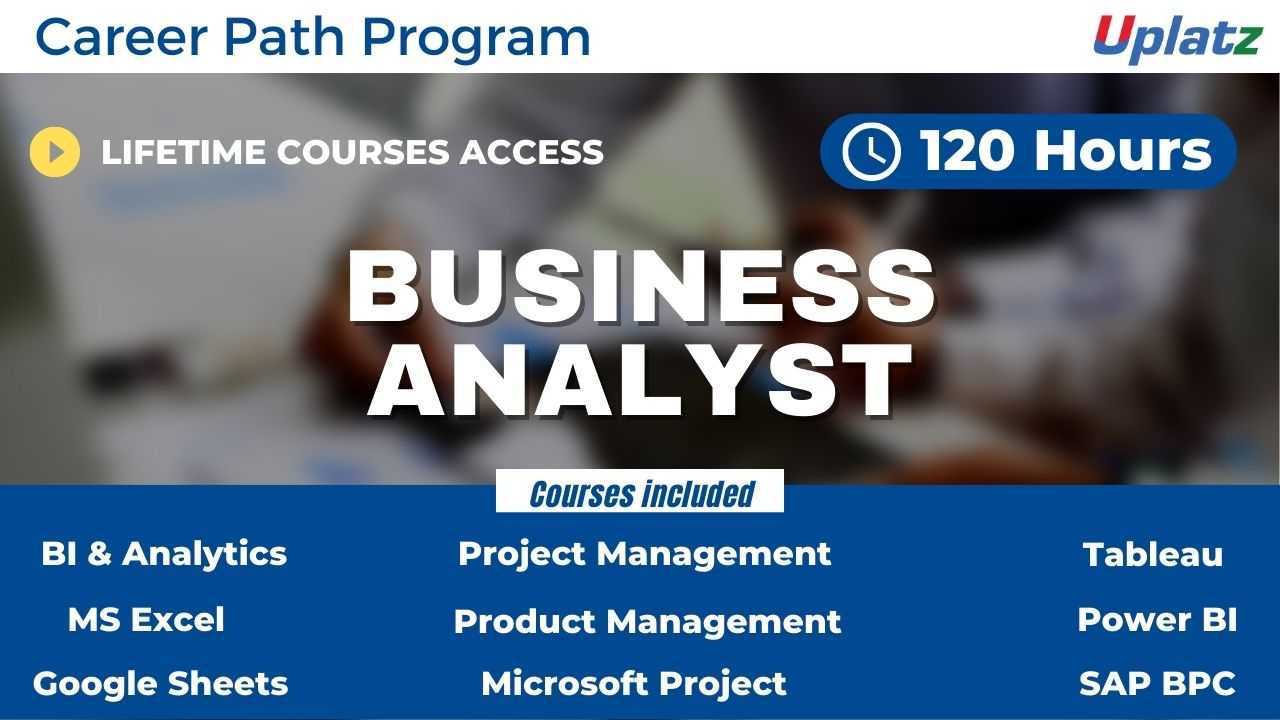
- Career Path - Business Analyst
- 120 Hours
- GBP 32
- 612 Learners

Who is a Business Intelligence Analyst?
A Business Intelligence (BI) Analyst is a data professional responsible for collecting, analyzing, and interpreting business data to support informed decision-making. BI Analysts bridge the gap between raw data and strategic insights by using tools and techniques to extract meaningful patterns, trends, and performance metrics.
Key Skills of a Business Intelligence Analyst
-
Data Analysis & Interpretation - Ability to derive insights from large datasets to guide business strategies.
-
SQL and Data Querying - Proficient in writing SQL queries to retrieve and manipulate data from databases.
-
Business Intelligence Tools - Experience with platforms like Power BI, Tableau, Qlik, Looker, or SAP BusinessObjects.
-
Data Warehousing and ETL - Understanding of data pipelines and storage, including tools such as Snowflake, Redshift, or Azure Synapse.
-
Statistical and Analytical Thinking - Capable of applying statistical techniques to assess performance and identify trends.
-
Advanced Excel Skills - Strong proficiency with spreadsheets, including pivot tables, data models, and complex formulas.
-
Data Visualization - Ability to create clear, impactful dashboards and visual reports.
-
Business Acumen - Understanding of business operations, KPIs, and industry-specific metrics.
-
Communication and Storytelling - Skilled at presenting complex data insights in a clear and compelling manner to non-technical stakeholders.
-
Programming (Optional but Advantageous) - Familiarity with Python or R for advanced analytics and automation is beneficial.
Roles and Responsibilities of a BI Analyst
-
Data Collection and Integration - Collaborate with departments to identify and access relevant data sources, including ERP, CRM, and cloud-based systems.
-
Reporting and Dashboard Development - Build and maintain reports and dashboards for real-time monitoring and strategic analysis.
-
Data Cleaning and Preparation - Ensure data accuracy, consistency, and readiness for analysis.
-
Trend and Pattern Identification - Analyze historical and real-time data to uncover insights that inform business decisions.
-
Collaboration with Stakeholders - Work closely with managers, executives, and cross-functional teams to understand information needs and deliver insights.
-
KPI Definition and Monitoring - Help define, track, and analyze key performance indicators (KPIs) relevant to the business.
-
Ad-Hoc Analysis - Conduct deep-dives into specific issues or questions raised by the business.
-
Documentation and Training - Document reporting processes and train users on BI tools and dashboards.
-
Promoting Data-Driven Culture - Encourage and support the organization in making decisions backed by data.
Career Progression
A BI Analyst may progress into roles such as: Senior Business Intelligence Analyst, Business Intelligence Developer, Data Analyst or Data Scientist, Analytics Manager, Data Product Manager, Chief Data Officer (CDO).
How the Business Intelligence Analyst Course from Uplatz Will Help You
The Business Intelligence (BI) Analyst course by Uplatz is designed to equip you with the technical expertise, analytical mindset, and business acumen required to thrive in the world of data-driven decision-making. Whether you're starting your data career or aiming to upskill, this course provides a comprehensive, industry-aligned learning path to help you succeed as a BI Analyst.
1. Practical, Job-Oriented Learning
This course offers hands-on experience with real-world business scenarios, helping you master the tools, workflows, and decision-making frameworks used by BI professionals every day. You’ll learn how to gather data, analyze trends, build dashboards, and present findings to stakeholders.
2. End-to-End BI Skill Development
The curriculum covers the entire BI lifecycle:
-
Data collection and querying using SQL
-
Data visualization using Power BI and Tableau
-
Data modeling and warehousing concepts
-
KPI tracking and business reporting
-
Introduction to ETL tools and automation workflows
These are core skills that employers seek in junior and mid-level BI analysts.
3. Exposure to In-Demand Tools and Platforms
You will gain proficiency in the industry’s most widely used tools, including:
-
SQL (MySQL, SQL Server)
-
Power BI
-
Tableau
-
Excel for analytics
-
Data warehousing systems and reporting tools
This toolset makes you immediately employable across industries.
4. Real Career Outcomes
By the end of the course, you will be able to:
-
Analyze business problems using data
-
Create compelling reports and dashboards for management
-
Support data-driven decision-making processes
-
Communicate insights clearly to non-technical stakeholders
-
Apply for roles such as BI Analyst, Data Analyst, or Reporting Specialist
5. Certification and Portfolio Development
You will receive a Uplatz Certificate of Completion, and through projects and assignments, you will build a professional portfolio to showcase your BI skills to potential employers or clients.
6. Flexible Learning with Expert Support
The course is self-paced but supported by expert mentors and community forums. You’ll benefit from continuous guidance, interview preparation, and career support.
Course/Topic - Course access through Google Drive
-
Google Drive
-
Google Drive
By the end of this course, you will be able to:
- Understand the fundamental concepts and architecture of Business Intelligence systems.
- Master SQL for advanced data querying, manipulation, and database management.
- Design, develop, and implement ETL processes for data warehousing.
- Create interactive and insightful dashboards and reports using tools like Tableau and Power BI.
- Perform data modeling, ensuring data quality and integrity.
- Apply various analytical techniques to derive actionable business insights.
- Create and apply best practices for logging, debugging, and securing Business Intelligence applications in a production environment.
- Communicate complex data findings effectively to stakeholders.
- Prepare and present data-driven recommendations for strategic business decisions.
Syllabus
- Module 1: Introduction to Business Intelligence
- What is Business Intelligence?
- Role of a BI Analyst
- BI Lifecycle and Architecture
- Data Warehousing Concepts
- Module 2: SQL for BI Analysts
- Relational Databases and SQL Basics
- Advanced SQL Queries (Joins, Subqueries, CTEs)
- SQL Functions and Stored Procedures
- Database Normalization
- Module 3: Data Extraction, Transformation, and Loading (ETL)
- ETL Process Overview
- Data Cleaning and Transformation Techniques
- Introduction to ETL Tools (e.g., SSIS concepts)
- Module 4: Data Modeling
- Dimensional Modeling (Star and Snowflake Schemas)
- Fact and Dimension Tables
- Data Granularity
- Module 5: Data Visualization with Tableau
- Introduction to Tableau Desktop
- Connecting to Data Sources
- Creating Charts and Graphs
- Building Interactive Dashboards and Stories
- Module 6: Data Visualization with Power BI
- Introduction to Power BI Desktop
- Data Import and Transformation (Power Query)
- DAX Formulas
- Report and Dashboard Design
- Module 7: Advanced Analytics for BI
- Descriptive and Diagnostic Analytics
- Introduction to Predictive Analytics
- Key Performance Indicators (KPIs) and Metrics
- Module 8: Communicating Insights
- Storytelling with Data
- Designing Effective Reports
- Presenting Data to Stakeholders
- Module 9: Capstone Project
- End-to-end BI Project Implementation
Upon successful completion of the course, learners will receive an industry-recognized Certificate of Completion from Uplatz that validates their skills as a Business Intelligence Analyst. This certification serves as a powerful addition to a resume or LinkedIn profile, demonstrating a candidate’s proficiency in data analysis, reporting, and visualization, and their ability to contribute to data-driven decision-making. It helps professionals stand out in job interviews and increases credibility when applying for roles such as BI Analyst, Data Analyst, or Business Intelligence Developer. The certificate reflects both theoretical understanding and practical experience gained through hands-on projects, making learners job-ready.
The demand for skilled Business Intelligence Analysts is rapidly growing across various industries as organizations increasingly rely on data to gain a competitive edge. Completing this course prepares learners for a range of exciting roles, including: Business Intelligence Analyst, Data Analyst, BI Developer, Reporting Analyst, and Data Warehouse Analyst. Professionals with strong BI skills are highly sought after in tech companies, consulting firms, financial institutions, healthcare providers, and e-commerce businesses. This course equips you with the in-demand skills to extract meaningful insights from complex datasets, create impactful reports and dashboards, and effectively communicate findings to drive business growth.
- What is Business Intelligence (BI)? BI is a technology-driven process for analyzing data and presenting actionable information to help executives, managers, and other corporate end users make informed business decisions.
- How does a BI Analyst contribute to a company? A BI Analyst collects, analyzes, and interprets complex data to identify trends, provide insights, and create reports and dashboards that support strategic business decisions and improve operational efficiency.
- What are the key differences between a Data Analyst and a BI Analyst? While both work with data, a Data Analyst often focuses on broader statistical analysis and modeling, whereas a BI Analyst is more focused on leveraging historical data to create reports and dashboards that provide actionable insights for business users to make informed decisions.
- Explain the ETL process. ETL stands for Extract, Transform, Load.
- Extract: Gathering data from various sources.
- Transform: Cleaning, enriching, and standardizing the data to fit the business requirements.
- Load: Moving the transformed data into a data warehouse or data mart for analysis.
- What is a data warehouse and why is it important for BI? A data warehouse is a centralized repository of integrated data from one or more disparate sources. It's crucial for BI because it provides a consistent, historical, and subject-oriented view of data, enabling efficient querying and analysis for reporting and decision-making.
- Name some popular BI tools you are familiar with. (Candidate should name tools like Tableau, Microsoft Power BI, QlikView, Looker, etc., based on their learning.)
- How do you ensure data quality in your BI projects? Data quality can be ensured through various methods, including data profiling, implementing data validation rules, data cleansing techniques during ETL, and establishing clear data governance policies.
- What are KPIs, and why are they important in BI? KPIs (Key Performance Indicators) are measurable values that demonstrate how effectively a company is achieving key business objectives. They are crucial in BI as they provide a clear, quantifiable way to track performance, identify areas for improvement, and inform strategic decisions.
- Describe the difference between a Star Schema and a Snowflake Schema.
- Star Schema: A simple data warehouse schema where a central fact table connects to multiple dimension tables, resembling a star.
- Snowflake Schema: An extension of the star schema where dimension tables are normalized into multiple related tables, creating a snowflake-like structure.
- How do you approach a new BI project, from understanding requirements to delivering insights? A typical approach involves:
- Requirements Gathering: Understanding business needs and objectives.
- Data Source Identification: Locating relevant data.
- Data Modeling: Designing the data warehouse/database structure.
- ETL Development: Building processes to extract, transform, and load data.
- Report/Dashboard Development: Creating visualizations and reports.
- Testing and Validation: Ensuring accuracy and usability.
- Deployment and Maintenance: Releasing and supporting the solution.
- Communication: Presenting insights and recommendations to stakeholders.