


( 479 Students )


Data Science with R
Practice Data Science using R programming language. Create visualizations & data science predictive models, and perform data analytics with R languagePreview Data Science with R course
Price Match Guarantee Full Lifetime Access Access on any Device Technical Support Secure Checkout Course Completion Certificate 94% Started a new career
BUY THIS COURSE (
94% Started a new career
BUY THIS COURSE (GBP 10 GBP 29 )-
 99% Got a pay increase and promotion
Students also bought -
-

- Machine Learning (basic to advanced)
- 65 Hours
- GBP 10
- 4543 Learners
-

- R Programming (basic to advanced)
- 20 Hours
- GBP 10
- 361 Learners
-
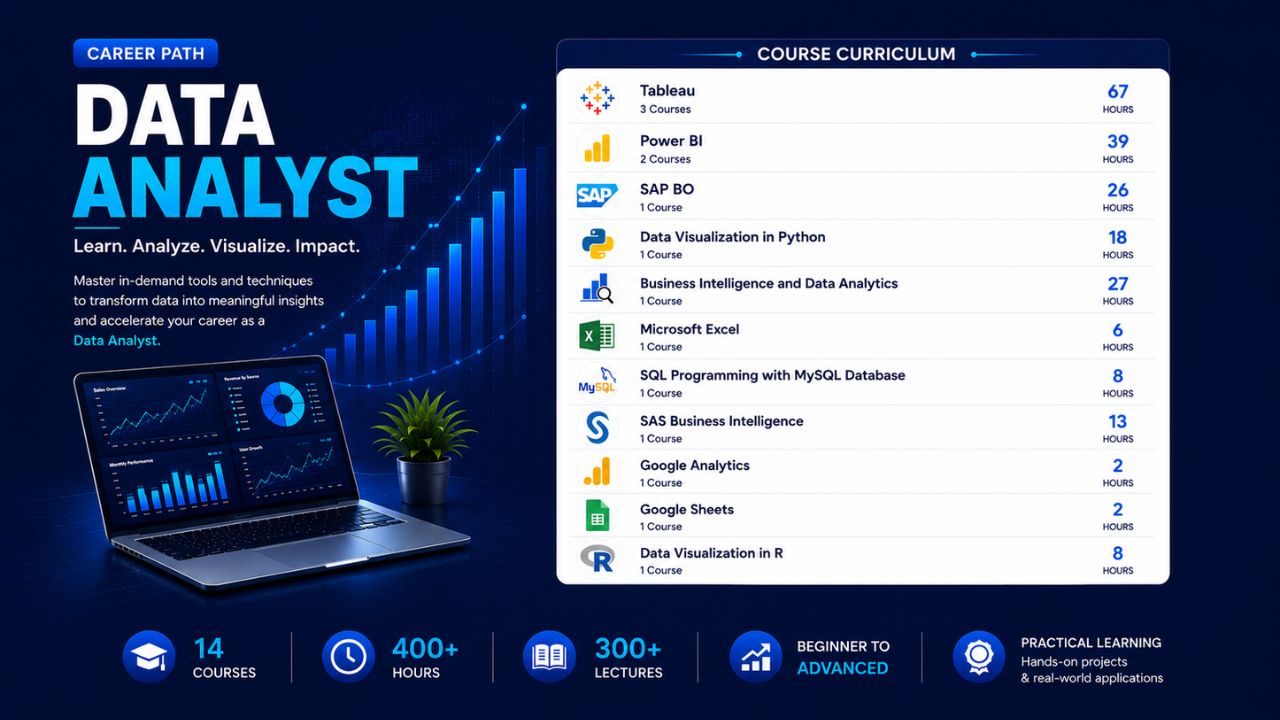
- Career Path - Data Analyst
- 400 Hours
- GBP 32
- 6488 Learners

Data science is a discipline that combines domain knowledge, programming abilities, and math and statistics understanding to extract useful insights from data.
Data Science is a field of study that entails using a variety of scientific methods, algorithms, and procedures to extract insights from large volumes of data. Data Science is an interdisciplinary field that allows you to extract knowledge from structured or unstructured data. R is a programming language that is used in data science to manage, store, and analyze data. It may be used for statistical modelling and data analysis. R is a statistical analysis environment. R includes a number of statistical and graphical features.
R analytics is a free, open-source programming language that may be used for a variety of data science, statistics, and visualization tasks. You may also use R to create and execute statistical models. Hence, automatically updating these as new information flows into the model. Data Science with R, is backed by only a few lines of code and stunning data visualizations. R might be used for consumer behavior analysis or genomics research, for example.
Uplatz offers a comprehensive training programmed in data science and machine learning using R. You will have a strong understanding of how to create predictive models using machine learning on your own.
Course/Topic - Data Science with R - all lectures
-
In this lecture session we learn about introduction of data science and also talk about features of data science in R.
-
In this lecture session we learn about data collection and management and also talk about features of data collection and management in data science with R.
-
In this lecture session we learn about model deployment and maintenance and also talk about functions of model deployment and maintenance in data science with R.
-
In this lecture session we learn about setting expectations and also talk about factors of setting expectations in brief.
-
In this lecture session we learn about loading data into R and also talk about features of loading data into R and also talk about the importance of loading data into R.
-
In this lecture session we learn about exploring data in data science and machine learning and also talk about features of exploring data in data science and machine learning.
-
In this lecture session we learn about features of exploring data using R and also talk about factors of exploring data using R.
-
In this lecture session we learn about benefits of data cleaning and also talk about features of benefits of data cleaning.
-
In this lecture session we learn about cross validation in R and also talk about features of validation in data science with R.
-
In these lecture sessions we learn about data transformation in data science with R and also talk about features of data transformation in brief.
-
In this lecture session we learn about modeling methods in data science with R and also talk about the importance of modeling methods.
-
In this lecture session we learn about solving classification problems and also talk about features of solving classification problems in brief.
-
In this lecture session we learn about working without known targets in data science with r and also talk about features of working without known targets.
-
In this lecture session we learn about evaluating models in data science with R and also talk about features of evaluating models in brief.
-
In this lecture session we learn about confusion matrix in indian accounting standards and also talk about features of confusion matrix.
-
In this lecture session we learn about introduction to linear regression and also talk about features of linear regression in indian accounting standards.
-
In this lecture session we learn about linear regression in R and also talk about features and functions of linear regression in brief.
-
In this lecture session we learn about linear regression in R in data science with r and also talk about features of linear regression in R language.
-
In this lecture session we learn about simple and multiple regression in data science with r and also talk about the basic difference between simple and multiple regression in brief.
-
In this lecture session we learn about linear and logistic regression in data science with r language and also talk about functions of linear and logistics regressions.
-
In this lecture session we learn about support vector machines (SVM) in R and also talk about features of support vector machines in data science with R language.
-
In this lecture session we learn about factors of support vectors machines in data science with R and also talk about features of support vectors machines.
-
In this lecture session we learn about unsupervised methods in data science with R and also talk about functions of unsupervised methods in data science.
-
In this lecture session we learn about clustering in data science with R language and also talk about features of clustering in data science.
-
In this lecture session we learn about K-means algorithms in R and also talk about all types of algorithms in data science with R language.
-
In this lecture session we learn about hierarchical clustering in data science with R language and also talk about features of hierarchical clustering.
-
In this lecture session we learn about libraries in data science with R and also talk about libraries of hierarchical clustering in brief.
-
In this lecture session we learn about the dendrogram of diana and also talk about all types of clustering in data science with R.
-
In this lecture session we learn about market basket analysis in data science with R and also talk about features of market basket analysis in data science with R.
-
In this lecture session we learn about MBA and association rule mining in data science with r language.
-
In this lecture session we learn about implementing MBA in data science with R and also talk about implementing MBA.
-
In this lecture session we learn about association rule learning in data science with R and also talk about features of association rule learning.
-
In this lecture session we learn about decision tree algorithms in data science with R and also talk about features of tree algorithms.
-
In this lecture session we learn about exploring advanced methods in tree algorithms in data science with R and also talk about features of exploring advanced methods.
-
In this lecture session we learn about using kernel methods and also talk about features of using kernel methods in data science with R.
-
In this lecture session we learn about documentation and deployment and also talk about features of documentation and deployment in data science with R.
· a) Students will develop relevant programming abilities.
b) Students will demonstrate proficiency with statistical analysis of data.
c) Students will develop the ability to build and assess data-based models.
d) Students will execute statistical analyses with professional statistical software
This syllabus is structured to provide a comprehensive understanding of data science concepts, methodologies, and practical applications.
1).Course Title: Data Science with R
Week 1: Introduction to Data Science
Overview of Data Science
a) Definition and significance
b) Data science lifecycle
2).Introduction to R
a) Installing R and RStudio
b) Basics of R programming
c) R syntax and data types
Week 2: Data Manipulation
3).Data Structures in R
a) Vectors, matrices, lists, and data frames
4).Data Import and Export
a) Reading and writing CSV, Excel, and databases
5).Data Manipulation with dplyr
a) Filtering, selecting, mutating, summarizing data
Week 3: Data Visualization
6).Introduction to Data Visualization
a) Importance and principles of visualization
7).Visualizing Data with ggplot2
a) Creating various types of plots (scatter, bar, line)
b) Customizing plots (themes, labels, colors)
Week 4: Exploratory Data Analysis (EDA)
8).Understanding EDA
a) Importance of EDA in data science
9).Techniques for EDA
a) Descriptive statistics
b) Correlation analysis
c) Outlier detection
10).Using R for EDA
a) Practical exercises with real datasets
Week 5: Probability and Statistics
Basic Concepts of Probability
a) Probability distributions (normal, binomial, etc.)
Statistical Inference
a) Hypothesis testing, confidence intervals
Using R for Statistical Analysis
a) Applying statistical tests with R
Week 6: Introduction to Machine Learning
Overview of Machine Learning
a) Types of machine learning (supervised, unsupervised)
b) Applications of machine learning in data science
Machine Learning with R
a) Introduction to caret and mlr packages
Week 7: Supervised Learning
Regression Analysis
a) Linear regression and its assumptions
b) Model evaluation metrics (RMSE, R-squared)
Classification Algorithms
a) Logistic regression, decision trees, and k-nearest neighbors
Hands-on Project
a) Building and evaluating a regression model
Week 8: Unsupervised Learning
Clustering Techniques
a) K-means clustering, hierarchical clustering
Dimensionality Reduction
a) Principal Component Analysis (PCA)
Hands-on Project
a) Applying clustering techniques to a dataset
Week 9: Model Evaluation and Tuning
Model Evaluation Techniques
a) Cross-validation, confusion matrix, ROC curve
Hyperparameter Tuning
a) Grid search and random search for model optimization
Using R for Model Evaluation
a) Practical exercises with model evaluation metrics
Week 10: Time Series Analysis
Introduction to Time Series
a) Components of time series data
Time Series Forecasting
a) ARIMA and exponential smoothing
Hands-on Project
a) Forecasting a time series dataset using R
Week 11: Working with Big Data
Overview of Big Data Technologies
a) Introduction to Hadoop and Spark
Using R with Big Data
a) Data manipulation and analysis with the data.table package
b) Connecting R with big data platforms (e.g., SparkR)
Week 12: Final Project and Presentation
Capstone Project
a) Apply learned skills to a real-world data science problem
Project Presentation
a) Present findings, methodologies, and results
Course Review and Next Steps
a) Discussion of career paths in data science and further learning resources
Course Materials:
1) Recommended Textbooks (e.g., "R for Data Science" by Hadley Wickham)
2) Online Resources and Tutorials
3) Access to R and relevant packages
Assessment:
1) Weekly assignments and quizzes
2) Participation in class discussions and group activities
3) Final project presentation and report
Prerequisites:
1) Basic understanding of statistics
2) Familiarity with programming concepts (recommended)
The Data Science with R Certification ensures you know planning, production and measurement techniques needed to stand out from the competition.
R in data science is used to handle, store and analyze data. It can be used for data analysis and statistical modeling. R is an environment for statistical analysis. R has various statistical and graphical capabilities.
The Data Science with R programming certification training covers data exploration, data visualization, predictive analytics, and descriptive analytics techniques with the R language.
R is now considered one of the most popular analytics tools in the world. In this certificate program you will develop the skill set necessary to perform key aspects of data science efficiently.
Statistics with R certification is one of the best courses to master statistics with R. You will learn to analyze and visualize data in R and create reproducible data analysis reports.
Uplatz online training guarantees the participants to successfully go through the Data Science with R Certification provided by Uplatz. Uplatz provides appropriate teaching and expertise training to equip the participants for implementing the learnt concepts in an organization.
Course Completion Certificate will be awarded by Uplatz upon successful completion of the Data Science with R online course.
The Data Science with R draws an average salary of $120,000 per year depending on their knowledge and hands-on experience.
The good news is R is developed by academics and scientists. It is designed to answer statistical problems, machine learning, and data science. R is the right tool for data science because of its powerful communication libraries.
R is a programming language that is becoming increasingly popular in the world of data science.R currently occupies the 13th place as the most popular programming languages in the world.
R programmers are most in-demand, especially in emerging startups. Some of the positions that are available for the R programmers are as follows: Data Scientist. Business Analyst.
Note that salaries are generally higher at large companies rather than small ones. Your salary will also differ based on the market you work in.
a).Data Science Manager
b).Data Science Analyst — Smart Devices
c).Product Data Scientist
d).Data Analyst
Q1.Explain about data import in R language.
Ans-R Commander is used to import data in R language. To start the R commander GUI, the user must type in the command Rcmdr into the console. There are 3 different ways in which data can be imported in R language:-
a).Users can select the data set in the dialog box or enter the name of the data set (if they know).
b).Data can also be entered directly using the editor of R Commander via Data->New Data Set. However, this works well when the data set is not too large.
c).Data can also be imported from a URL or from a plain text file (ASCII), from any other statistical package or from the clipboard.
Q2.dplyr package is used to speed up data frame management code. Which package can be integrated with dplyr for large fast tables?
Ans-data.table
Q3.In base graphics system, which function is used to add elements to a plot?
Ans-boxplot () or text ()
Q4.What is the purpose of using Next statement in R language?
Ans-If a developer wants to skip the current iteration of a loop in the code without terminating it then they can use the next statement. Whenever the R parser comes across the next statement in the code, it skips evaluation of the loop further and jumps to the next iteration of the loop.
Q5.What is the process to create a table in R language without using external files?
Ans-MyTable= data.frame ()
edit (MyTable)
The above code will open an Excel Spreadsheet for entering data into MyTable.
Q6.What is the best way to communicate the results of data analysis using R language? (get solved use-cases + code)
Ans-The best possible way to do this is combine the data, code and analysis results in a single document using knitr for reproducible research. This helps others to verify the findings, add to them and engage in discussions. Reproducible research makes it easy to redo the experiments by inserting new data and applying it to a different problem.
Q7.How many data structures does R language have?
Ans-R language has Homogeneous and Heterogeneous data structures. Homogeneous data structures have same type of objects – Vector, Matrix ad Array. Heterogeneous data structures have different type of objects – Data frames and lists.
Q8. What is the difference between data frame and a matrix in R?
Ans-Data frame can contain heterogeneous inputs while a matrix cannot. In matrix only similar data types can be stored whereas in a data frame there can be different data types like characters, integers or other data frames.
Q9.How can you add datasets in R?
Ans-rbind () function can be used add datasets in R language provided the columns in the datasets should be same.
Q10.What is Power Analysis?
Ans-The power analysis is an integral part of the experimental design. It helps you to determine the sample size requires to find out the effect of a given size from a cause with a specific level of assurance. It also allows you to deploy a particular probability in a sample size constraint.
Q11.Explain Collaborative filtering
Ans-Collaborative filtering used to search for correct patterns by collaborating viewpoints, multiple data sources, and various agents.
Q12.What is bias?
Ans-Bias is an error introduced in your model because of the oversimplification of a machine learning algorithm.” It can lead to underfitting.
Q13.Discuss ‘Naive’ in a Naive Bayes algorithm?
Ans-The Naive Bayes Algorithm model is based on the Bayes Theorem. It describes the probability of an event. It is based on prior knowledge of conditions which might be related to that specific event.
Q14.What is a Linear Regression?
Ans-Linear regression is a statistical programming method where the score of a variable ‘A’ is predicted from the score of a second variable ‘B’. B is referred to as the predictor variable and A as the criterion variable.
Q15.State the difference between the expected value and mean value
Ans-They are not many differences, but both of these terms are used in different contexts. Mean value is generally referred to when you are discussing a probability distribution whereas expected value is referred to in the context of a random variable.
Q16.What the aim of conducting A/B Testing?
Ans-AB testing used to conduct random experiments with two variables, A and B. The goal of this testing method is to find out changes to a web page to maximize or increase the outcome of a strategy