


( 10 Students )


Grafana Stack
Master Grafana and its observability stack to monitor, visualize, and analyze metrics, logs, and traces for modern applications and infrastructure. Price Match Guarantee
Full Lifetime Access
Access on any Device
Technical Support
Secure Checkout
Course Completion Certificate
Price Match Guarantee
Full Lifetime Access
Access on any Device
Technical Support
Secure Checkout
Course Completion Certificate
 95% Started a new career
BUY THIS COURSE (
95% Started a new career
BUY THIS COURSE (GBP 10 GBP 29 )-
 85% Got a pay increase and promotion
Students also bought -
-
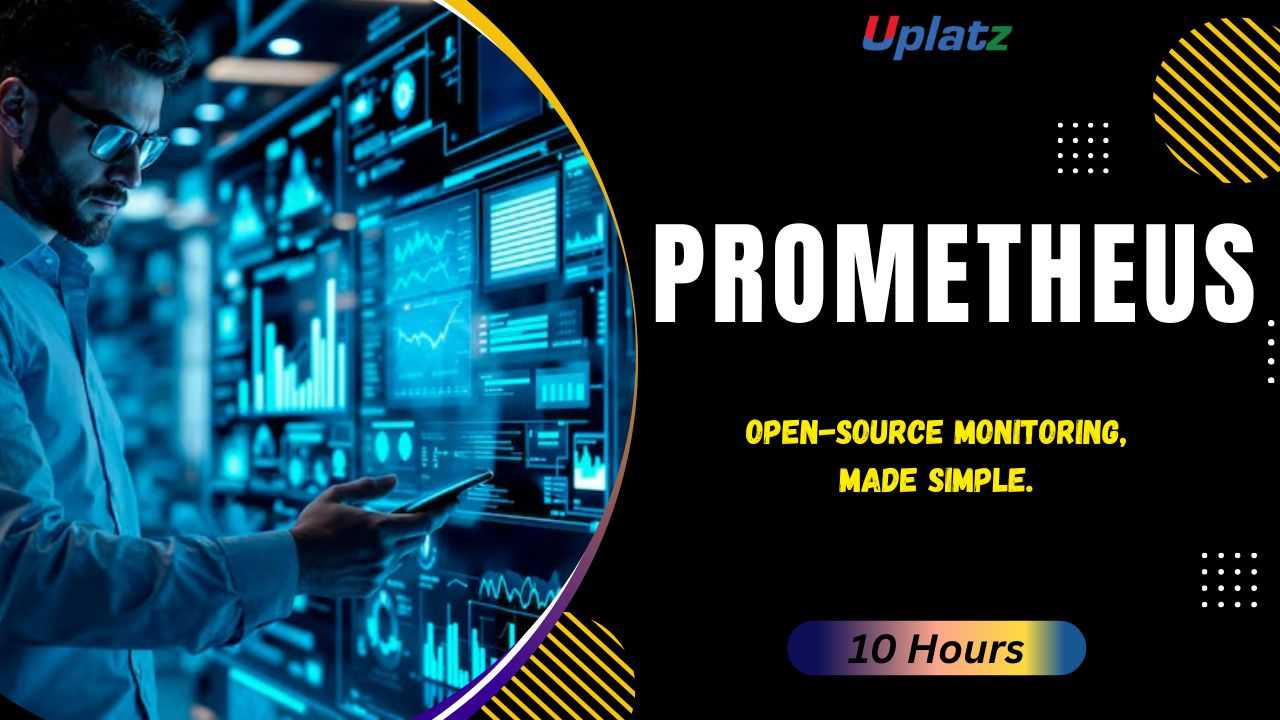
- Prometheus
- 10 Hours
- GBP 10
- 10 Learners
-

- Kubernetes
- 20 Hours
- GBP 10
- 355 Learners
-
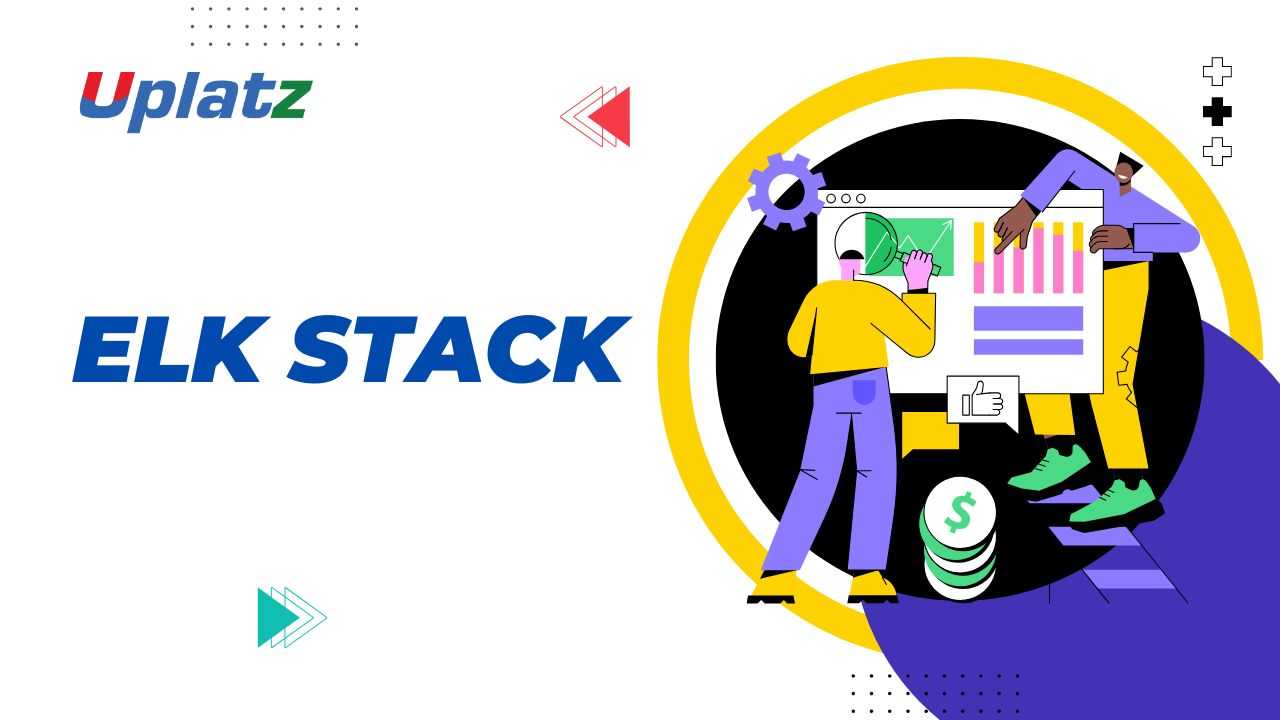
- ELK Stack
- 10 Hours
- GBP 10
- 10 Learners

The Grafana Stack is one of the most widely adopted open-source observability platforms used by organizations around the world to gain real-time visibility into systems, applications, and infrastructure. At its core, Grafana provides rich, interactive dashboards for visualizing metrics, logs, and traces—making it the heart of modern monitoring solutions.
Together with its companion tools—Prometheus for metrics, Loki for logs, and Tempo for distributed tracing—the Grafana Stack forms a comprehensive observability ecosystem. Whether you’re running workloads on Kubernetes, managing multi-cloud environments, or operating complex microservice architectures, the Grafana Stack provides everything you need to collect, store, analyze, and visualize data from end to end.
This course takes a hands-on, project-based approach to mastering the Grafana Stack. You’ll learn how to deploy, configure, and integrate its core components to build a unified monitoring pipeline that provides deep insights into system performance and reliability. By the end, you’ll have the skills to design, implement, and scale observability solutions for real-world DevOps environments.
🔍 What is the Grafana Stack?
The Grafana Stack is a suite of open-source tools designed to make observability simple, scalable, and unified. Each component of the stack addresses a different layer of the monitoring ecosystem:
-
Grafana: A visualization platform that allows you to create customizable, interactive dashboards from multiple data sources such as Prometheus, Elasticsearch, InfluxDB, MySQL, and more.
-
Prometheus: A metrics collection and alerting system that scrapes, stores, and queries time-series data. It’s ideal for monitoring system and application performance in real time.
-
Loki: A log aggregation system optimized for efficiency and scalability. Unlike traditional logging tools, Loki indexes only metadata, making it cost-effective and easy to correlate with metrics and traces.
-
Tempo: A distributed tracing backend that helps developers analyze and debug complex microservices architectures by visualizing request flows and latency bottlenecks.
When integrated, these tools provide a complete observability pipeline—from metrics to logs to traces—empowering teams to detect issues faster, reduce downtime, and improve system reliability.
⚙️ How the Grafana Stack Works
At a high level, the Grafana Stack collects telemetry data (metrics, logs, and traces) from multiple sources and brings them together in a single interface for visualization and analysis.
-
Prometheus scrapes metrics from exporters (like node_exporter, cAdvisor, or application-specific endpoints) and stores them as time-series data.
-
Loki gathers and indexes log streams from containers, servers, and applications, storing them efficiently for on-demand queries.
-
Tempo captures distributed traces generated by instrumented applications, making it easy to trace requests across multiple services.
-
Grafana then connects to all these data sources, allowing users to build dashboards, create alerts, and visualize system performance in real time.
This unified workflow enables correlation across data types—you can jump from an alerting metric to related logs and traces within seconds, giving full context for faster troubleshooting and root-cause analysis.
🏭 How the Grafana Stack is Used in the Industry
The Grafana Stack has become a de facto standard for observability across cloud-native and enterprise environments. It’s used by companies like PayPal, Bloomberg, eBay, and Netflix to monitor massive distributed systems and maintain uptime.
Common industry use cases include:
-
Kubernetes Monitoring: Observing cluster health, pod metrics, and workloads across namespaces.
-
Microservices Performance Tracking: Visualizing API latency, request throughput, and tracing dependencies.
-
DevOps & SRE Dashboards: Providing real-time infrastructure visibility to operations teams.
-
Cloud Cost Optimization: Tracking resource usage across AWS, Azure, and GCP environments.
-
Application Reliability: Detecting performance anomalies before they affect users.
Its open-source nature and strong ecosystem of plugins make the Grafana Stack flexible enough for small startups and powerful enough for large-scale enterprise deployments.
🌟 Benefits of Learning the Grafana Stack
-
Unified Observability: Integrate metrics, logs, and traces in a single pane of glass.
-
Vendor-Neutral Flexibility: Connect to dozens of data sources, both open-source and commercial.
-
Real-Time Monitoring: Build dynamic dashboards that update instantly as your infrastructure changes.
-
Actionable Insights: Set up alerting and notification systems that drive proactive issue resolution.
-
Scalability and Performance: Handle millions of time-series metrics efficiently.
-
Career Growth: Observability and monitoring expertise are highly sought-after in DevOps, SRE, and Cloud roles.
-
Open-Source Advantage: Learn tools trusted by the global engineering community.
By mastering the Grafana Stack, you’ll gain a critical skill set at the intersection of DevOps, cloud computing, and reliability engineering.
📘 About This Course
This Grafana Stack Masterclass covers the full observability lifecycle—from data collection to visualization, alerting, and performance optimization. It combines theoretical understanding with real-world, hands-on practice to help you become proficient in designing monitoring architectures.
Key topics include:
-
Fundamentals of metrics, logs, and tracing.
-
Installing and configuring Prometheus, Loki, Tempo, and Grafana.
-
Collecting system and application metrics using exporters.
-
Querying and analyzing data using PromQL and LogQL.
-
Building interactive dashboards for operations, infrastructure, and business metrics.
-
Implementing alerting rules and integrating with Slack, PagerDuty, and email.
-
Correlating metrics, logs, and traces for efficient troubleshooting.
-
Deploying the Grafana Stack using Docker, Kubernetes, or cloud providers.
-
Securing and scaling Grafana for enterprise use.
By the end of the course, you’ll know how to build end-to-end observability pipelines and confidently deploy them in production environments.
👩💻 Who Should Take This Course
This course is designed for professionals who want to gain practical observability expertise using the Grafana Stack:
-
DevOps Engineers managing CI/CD pipelines and system performance.
-
Site Reliability Engineers (SREs) responsible for uptime and operational efficiency.
-
Cloud & Kubernetes Engineers needing integrated monitoring and alerting systems.
-
Backend Developers who want deeper insight into their applications’ performance.
-
Students & IT Professionals exploring observability and infrastructure monitoring.
Whether you’re an experienced engineer or just beginning your DevOps journey, this course provides a complete roadmap to mastering observability with open-source tools.
🧩 Course Structure and Learning Format
The course is organized into progressive, self-paced modules combining conceptual lessons and guided lab exercises.
Each module includes:
-
Step-by-step video tutorials with real-time demos.
-
Downloadable YAML, Docker Compose, and configuration files.
-
Hands-on exercises for collecting and visualizing telemetry data.
-
Assignments and quizzes to reinforce understanding.
-
End-to-end mini projects to simulate production scenarios.
You’ll also gain lifetime access to all course materials and updates, ensuring you stay up to date with evolving Grafana and Prometheus ecosystems.
🧭 How to Use This Course Effectively
-
Start with Prometheus and Grafana basics before exploring Loki and Tempo.
-
Deploy on your local or cloud environment (Docker, Minikube, or Kubernetes).
-
Experiment with exporters for databases, web servers, and system metrics.
-
Build custom dashboards and alerts to monitor real applications.
-
Simulate failures and analyze traces to understand system resilience.
-
Engage with the community—Grafana Labs’ documentation, forums, and plugins are invaluable for deeper learning.
This hands-on approach ensures you develop both conceptual clarity and practical mastery of the Grafana Stack.
🚀 Final Takeaway
In modern DevOps and cloud-native ecosystems, observability is no longer optional—it’s essential. The Grafana Stack empowers teams to monitor complex systems, visualize performance in real time, and troubleshoot faster than ever before.
By the end of this course, you’ll be able to:
-
Deploy and manage the full Grafana Stack.
-
Collect, store, and visualize data from multiple sources.
-
Build interactive dashboards and actionable alerts.
-
Integrate observability into CI/CD and Kubernetes workflows.
-
Correlate metrics, logs, and traces for instant root-cause analysis.
Whether you’re monitoring a single application or managing global infrastructure, this course gives you the knowledge and tools to deliver reliable, observable, and high-performing systems using the Grafana Stack.
Start your observability journey today—and build the skills that power the backbone of modern cloud and DevOps environments.
By the end of this course, learners will be able to:
-
Deploy and configure the Grafana Stack (Grafana, Prometheus, Loki, Tempo).
-
Collect, store, and visualize metrics, logs, and traces.
-
Build custom dashboards and alerts for monitoring.
-
Integrate observability into Kubernetes and cloud-native apps.
-
Apply best practices for scaling observability systems.
Course Syllabus
Module 1: Introduction to Observability
-
Why observability matters
-
Monitoring vs logging vs tracing
-
Grafana Stack overview
Module 2: Grafana Basics
-
Installation and setup
-
Creating dashboards and panels
-
Data sources and plugins
Module 3: Prometheus – Metrics Collection
-
Prometheus fundamentals
-
Node exporter and app exporters
-
PromQL queries for monitoring
Module 4: Loki – Logs Aggregation
-
Setting up Loki
-
Pushing logs with Promtail
-
LogQL queries
Module 5: Tempo – Distributed Tracing
-
Tracing fundamentals
-
Integration with Jaeger/Zipkin
-
Using Tempo in microservices
Module 6: Alerting and Notifications
-
Alertmanager setup
-
Defining alert rules in Prometheus
-
Integrations (Slack, PagerDuty, email)
Module 7: Kubernetes & Cloud Integrations
-
Monitoring Kubernetes clusters
-
Dashboards for pods, nodes, and workloads
-
Deploying Grafana Stack with Helm
Module 8: Advanced Features
-
Security and authentication in Grafana
-
Dashboards as code (Grafana provisioning)
-
High availability and scaling
Module 9: Real-World Projects
-
Infrastructure monitoring dashboard
-
E-commerce app observability (metrics + logs + traces)
-
End-to-end Kubernetes observability stack
Module 10: Production Best Practices
-
Resource optimization
-
Backup and disaster recovery
-
Common troubleshooting
On completion, learners receive a Certificate of Completion from Uplatz validating skills in Grafana Stack, observability pipelines, and cloud-native monitoring. This certification demonstrates readiness for roles in DevOps, SRE, and Cloud Engineering.
Grafana Stack expertise prepares you for roles such as:
-
DevOps Engineer (Observability)
-
Site Reliability Engineer (SRE)
-
Cloud Monitoring Specialist
-
Infrastructure Engineer
-
Observability Architect
Grafana is widely used by Google, PayPal, Siemens, eBay, and thousands of enterprises, making it a valuable, in-demand skill.
-
What is the Grafana Stack?
It’s a suite including Grafana, Prometheus, Loki, and Tempo for unified observability (metrics, logs, traces). -
How does Prometheus collect metrics?
Prometheus uses a pull model to scrape metrics from endpoints exposed by exporters. -
What is PromQL?
PromQL is Prometheus Query Language used to query and aggregate time-series metrics. -
What is Loki and how does it differ from ELK?
Loki is a log aggregation system optimized for storing logs with minimal indexing, unlike ELK which heavily indexes logs. -
How does Tempo help with observability?
Tempo provides distributed tracing, helping track requests across microservices. -
How do you secure a Grafana deployment?
By enabling user authentication, role-based access control, and HTTPS. -
What are Grafana data sources?
Grafana can connect to Prometheus, Loki, InfluxDB, Elasticsearch, MySQL, and many others. -
How does alerting work in Grafana Stack?
Prometheus defines alert rules; Alertmanager routes alerts; Grafana provides visualization. -
How do you monitor Kubernetes with Grafana Stack?
By deploying Prometheus, node exporters, and kube-state-metrics, then visualizing in Grafana dashboards. -
Where is Grafana Stack commonly used?
It is widely used in DevOps pipelines, cloud-native observability, application monitoring, and infrastructure management.