


( 186 Students )


Power BI (basic to advanced)
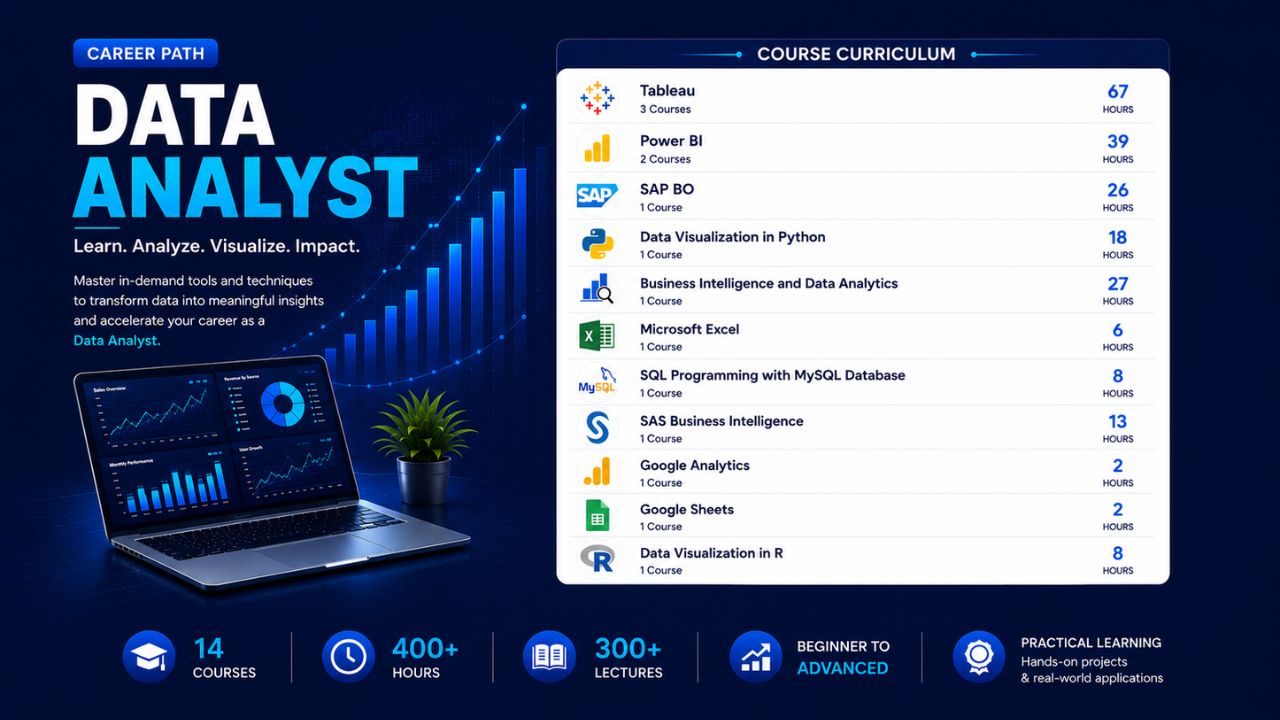
Master data visualization & business intelligence with Power BI. Deep-dive into features & analytical capabilities of Power BI. Become a Data Analyst. View Course Curriculum
Price Match Guarantee
Full Lifetime Access
Access on any Device
Technical Support
Secure Checkout
Course Completion Certificate
View Course Curriculum
Price Match Guarantee
Full Lifetime Access
Access on any Device
Technical Support
Secure Checkout
Course Completion Certificate
 82% Started a new career
BUY THIS COURSE (
82% Started a new career
BUY THIS COURSE (GBP 10 GBP 29 )-
 78% Got a pay increase and promotion
Students also bought -
-
- Career Path - Data Analyst
- 400 Hours
- GBP 32
- 6488 Learners
-

- Bundle Combo - Data Science (with Python and R)
- 70 Hours
- GBP 15
- 3110 Learners
-

- SQL Programming with MySQL Database
- 8 Hours
- GBP 10
- 4562 Learners

Power BI is one of the most powerful business intelligence platforms for data modeling. Power BI's real-time dashboard sorts and presents data from multiple sources so organizations can better manage their customers, operations, and futures.
If you are good at Power BI and DAX, you can create real added value for your company and not just put the numbers together. Whether it's a simple Excel file, working with SQL Server or a complex set of local and cloud data, Power BI can sort it all.
Power BI is an analytics tool developed by Microsoft that turns your bits of unstructured data into a visually compelling story. It consists of the Power BI Desktop, the SaaS Power BI Service, and a range of mobile apps (iOS and Android compatible). These tools take big data and help your business or organization ask the right questions and receive actionable insights.
Power BI takes information from disparate data sources and turns them into custom visuals designed to help an organization not only read the info but get a clear idea of what to do. The right data visualization can be the difference between having unstructured data that disappears and using that data to make critical (and more importantly, correct) decisions.
Power BI is basically a very new tool in the hands of companies that are overwhelmed by the amount of data available and yet have cheap tools to extract insights. After completing this course, as a trained professional, you will have access to Power BI.
It is a set of tools and applications that allow you to extract data from multiple independent sources and turn it into a compelling, well-managed and consistent collection of information. Insights, interactive data, charts, graphs and reports.
With this Power BI course from Uplatz, you will have a range of potential careers including data scientists, product managers, and business analysts. Understanding power query, the role played by data warehouses, and everything from Microsoft flow to self-service analytics makes Power BI skilled users the valuable resources for a variety of organizations. Analysts use the Power BI robust platform to discover key insights that can change the course of a business or organization for the better.
This Power BI training will provide you comprehensive knowledge of the tool as well as it's practical implementation in the industry scenarios.
Course/Topic - Power BI (basic to advanced) - all lectures
-
This is an introductory video of Power BI to get you started in this tutorial video, learn how to get started using Microsoft Power BI. Power BI allows you to get insight from your business data.
-
Microsoft Power BI is one of the most popular Data Visualization and Business Intelligence tool. The Power BI tool is the collection of apps, data connectors, and software services which are used to get the data from different data sources, transforms data, and produces useful reports.
-
In Microsoft Power BI services which are based on SaaS and mobile Power BI apps that are available for different platforms. These set of services are used by the business users to consume data and to build Power BI reports.
-
This tutorial helps you to clear all the essential concepts in Power BI and provides enough knowledge on how to use Power BI or how to work on Power BI.
-
The BI term refers to Business Intelligence. It is a data-driven decision support system, which helps you to analyse the data and provide actionable information. It helps the business manager, corporate executives, and other users in making their decisions easily.
-
This Business intelligence refers to the applications, technologies, and practices for the collection, analysis, integration, and presents the business information. The purpose of business intelligence is to support better decision making.
-
Business intelligence is used to improve all parts of a company by improving access to the firm's data and then using that data to increase profitability. Companies that practice BI can translate their collected data into insights their business processors.
-
Power BI is a Data Visualization, and Business Intelligence tool which helps to convert data from different data sources into interactive dashboards and BI reports. It provides interactive visualizations with self-service business intelligence capabilities where end users can create reports and dashboards by themselves, without having to depend on information technology staff or database administrators.
-
Power BI provides multiple connectors, software, and services. These services based on the SaaS and mobile Power BI apps which are available for different platforms. These set of services are used by business users to consume data and to build BI reports.
-
Power BI dashboard is a single page, also called a canvas that uses visualization to tell the story. It is limited to one page; therefore, a well-designed dashboard contains only the most essential elements of that story.
-
A Power BI report is a multi-perspective view into the dataset, with visualizations which represent different findings and insights from that dataset.
-
Power BI Desktop and Power BI Services support a large range of data sources. Click on the Get Data button, and it shows you all the available data connections. You can connect to different Flat files, Azure cloud, SQL database, and Web platforms, also such as Google Analytics, Facebook, and Salesforce objects. It includes an ODBC connection to connect to other ODBC data sources.
-
In this section of the Power BI tutorial, we will learn about each of these Power BI services or components and their roles.
-
In this section, we will briefly walk through a case study of Power BI. This will help to understand the role of Power BI in a real-life scenario.
-
Moving forward in our Power BI tutorials series, let us explore some important features of Power BI thoroughly. Power BI is an efficient business intelligence tool loaded with data visualization and analytics rich features.
-
This Power BI tutorial we’re going to learn from the basics then we will gradually move upwards, learn about its components and how it works.
-
In this tutorial, we studied Power BI Architecture. Today, we will discuss Power BI Building Blocks. In this Power BI Tutorial, we are going to explore the components of Power BI: Visualizations, Datasets, Reports, Dashboards, and Tiles. So, let’s start the Power BI Building Blocks Tutorial.
-
In this Power BI Tutorial, we will discuss Power BI Query, Power BI Pivot, Power BI View, Power BI Map, Power BI Q&A, Power BI Desktop, Power BI Website, and Power BI Mobile Apps. So, let’s start the Power BI Components Tutorial.
-
we learn how to download and Install Power BI. First of all, we will see a list of an operating system which supports Power BI. Moreover, we will study, seven simple and quick steps to install power BI on windows.
-
In this lesson, we are going to discuss the pros and cons of Power BI. As we learned from the tutorial on Features of Power BI, it’s a great tool to use for data analysis and discovering important insights. But, let us go into a little detail and learn about the advantages and disadvantages of Power BI so that you can have some basis to compare it with other tools.
-
In this Power Bi tutorial, we will study about Power BI data modeling. Moreover, we will see how we use Data Modeling in Power BI, and how to Create Calculated Columns in Data Modeling in Power BI.
-
In addition, we will talk about how to Create a Calculated table in Power BI Data Modeling and Use information Modeling and Navigation.
-
In Power BI Tutorial, we talked about Power BI Dashboard. Here, we are going to create Workspace in Power BI or in other words we are creating groups in Power BI Workspace.
-
Moving forward in our series of Power BI tutorials, the next interesting topic is Power BI Dashboard. Power BI Dashboard is a fundament element in Power BI Desktop.
-
In Power BI tutorial, we studied How to Create Workspace in Power BI. Today, in this instructional exercise, we will figure out how to Share Power BI Dashboard – Outside Organization/Clients. Moreover, we will discuss different ways to share internal & external clients.
-
Despite the fact that Power BI is intended for you to impart a dashboard to clients who are inside a similar association, you can likewise impart dashboards to individuals from different associations.
-
In this Power BI tutorial, we will learn about how Power BI Create dashboard & report on iPhone, iPad, Android Phone, Android Tablet, Windows 10. Moreover, we will discuss the How power BI view dashboard on land space mode of Windows 10 Devices.
-
Whenever you will search for Power BI Desktop on Google, you will find many websites covering the installation and functions of Power BI in a technical language. But here I am providing you with all the aspects of Power BI in a very simple language.
-
In this Power BI tutorial, we will learn about Interface with information in Power BI work area. Moreover, we will learn how to connect to data in Power BI Desktop.
-
In our tutorial, we discussed Analytics Pane in Power BI. Today, in this Q & A in Power BI Desktop Tutorial, we will learn how to add a missing relationship and rename tables and columns. Moreover, we will study how to fix incorrect data types and choose the data category for each date and geography column. At last, we will cover to normalize your model.
-
In this tutorial, we will study Power BI Measure. Today, we are going to learn the Power BI Archived Workspace. Moreover, we will study the Confinements and Moving Content in your Archived Workspace in Power BI. At last, we will cover the Power BI Archived Workspace in Office 365.
-
In this video, we talked about the Power BI Archived Workspace. In this Power BI Data Source Tutorial, we are going to learn Data Sources for Power BI Services. Moreover, we are going to discuss how data originates from an alternate source and some subtle elements. Along with this, we will cover the types of data sources for Power BI.
-
In this Power BI tutorial, we will study Power BI Data Source. Today in this Power BI Admin tutorial, we will learn about the various roles of Power BI administration: Purchasing, REST API, and Security.
-
Continuing with our Power BI tutorial series, now, we will learn about Power BI Report Server. As we know, Power BI as a technology is a collection of several other technologies and services. Power BI Report Server is one such crucial technology. Here, we will learn about its different aspects.
-
In this session we are going to explore the working of a table in Power BI. In addition, we will discuss when to use a Power BI table with its prerequisites. Along with this we will study how to Create a table & Format the table, and adjust the column width of a table in Power BI.
Course Objectives
• Explain Power Query and Power BI Desktop
• Describe Data Visualization
• Understand the concepts of Power BI, Power Map, Power Pivot, Power view
• Create Custom Visualizations
• Discuss Power BI with SSRS Reports
• Describe DAX
• Develop real-time dashboards
• Learn how to integrate Power BI with Azure Machine Learning
• Connect directly to SSAS, Azure SQL, HD Spark
• Understand Power BI Q&A and Data insights
• Explain Power BI Embedded
• Discuss Power BI Administration
• Publish and share reports and dashboards
Power BI (basic to adv) – Course Syllabus
Module 1 - Introduction to Power BI
1.1 Introduction to Microsoft Power BI
1.2 The key features of Power BI workflow
1.3 Desktop application
1.4 BI service
1.5 File data sources
1.6 Sourcing data from web (OData, Azure)
1.7 Building dashboard
1.8 Data visualization
1.9 Publishing to cloud
1.10 DAX data computation
1.11 Row context
1.12 Filter context
1.13 Analytics Pane
1.14 Creating columns and measures
1.15 Data drill down and drill up
1.16 Creating tables
1.17 Binned tables
1.18 Data modeling and relationships
1.19 The Power BI components like Power View, Map, Query, Pivot
1.20 Power Q & A
1.21 Understanding advanced visualization
Hands-on Exercise –
1. Demo of building a Power BI dashboard
2. Source data from web
3. Publish to cloud
4. Create power tables
Module 2 - Extracting Data
2.1 Learning about Power Query for self-service ETL functionalities
2.2 Introduction to data mashup
2.3 Working with Excel data
2.4 Learning about Power BI Personal Gateway
2.5 Extracting data from files, folders and databases
2.6 Working with Azure SQL database and database source
2.7 Connecting to Analysis Services
2.8 SaaS functionalities of Power BI
Hands-on Exercise –
1. Connect to a database
2. Import data from an excel file
3. Connect to SQL Server
4. Analysis Service
5. Connect to Power Query
6. Connect to SQL Azure
7. Connect to Hadoop
Module 3 - Power Query for Data Transformation
Module 4 - Power Pivot for Data Modeling and Data Analysis Expression - DAX Queries
Module 5 - Data Visualization with Analytics
Module 6 - Power Q & A
Module 7 - Power BI Desktop & Administration
Module 8 - Microsoft Course
The Microsoft Power BI Certification ensures you know planning, production and measurement techniques needed to stand out from the competition.
Microsoft Power BI is used to run reports and surface insights based on a company's data. Power BI can connect to a wide range of data sets, and “tidies up” the info it's fed so that it can be better digested and understood. The reports and visuals generated from this data can then be shared with other users.
Power BI is a collection of software services, apps, and connectors that work together to turn your unrelated sources of data into coherent, visually immersive, and interactive insights. Your data may be an Excel spreadsheet, or a collection of cloud-based and on-premises hybrid data warehouses.
You will receive a Course Completion Certificate from SkillUp upon completing the Power BI Basics free program. You can unlock it by logging in to your SkillUp account.
Whether you're actively searching for a new role or pursuing professional development, Microsoft Certification Training is a lucrative asset for your career. Many recruiters actively headhunt IT professionals that have invested in and completed official Microsoft Training.
Uplatz online training guarantees the participants to successfully go through the Microsoft Power BI Certification provided by Uplatz. Uplatz provides appropriate teaching and expertise training to equip the participants for implementing the learnt concepts in an organization.
Course Completion Certificate will be awarded by Uplatz upon successful completion of the Microsoft Power BI online course.
The Microsoft Power BI draws an average salary of $115,000 per year depending on their knowledge and hands-on experience.
Among all BI tools, Power BI has emerged as the leader in business analytics. Today, there is much demand for Power BI-certified professionals in most MNCs and bigger firms. Power BI jobs will offer you handsome salaries and give you a chance of working with top companies.
Power BI is a suite, which is a collection of business intelligence tools such as software services, apps, and data connectors. Power BI offers robust analytics and reporting capabilities for corporations and is also a great career option in this increasingly data-based economy.
Note that salaries are generally higher at large companies rather than small ones. Your salary will also differ based on the market you work in.
Power BI Developer.
Power BI Expert.
Microsoft Power BI Application Lead.
1. What is Power BI?
Power BI is a business analytics tool developed by Microsoft that helps you turn multiple unrelated data sources into valuable and interactive insights. These data may be in the form of an Excel spreadsheet or cloud-based/on-premises hybrid data warehouses. You can easily connect to all your data sources and share the insights with anyone.
2. Difference between Power BI and Tableau
Both Tableau and Power BI are the current IT industry's data analytics and visualization giants. Yet, there are a few significant differences between them. You will now explore the important differences between Tableau and Power BI.
|
Tableau |
Power BI |
|
Tableau uses MDX for measures and dimensions |
Power BI uses DAX for calculating measures |
|
Tableau is capable of handling large volumes of data |
Power BI is qualified only to handle a limited amount of data |
|
Tableau is best suitable for experts |
Power BI is suitable for both experts and beginners |
|
Tableau User Interface is complicated |
Power BI User Interface is comparatively simpler |
|
Tableau is capable of supporting the cloud with ease. |
Power BI finds it difficult, as its capacity to handle large volumes of data is limited. |
3. Difference between Power Query and Power Pivot
The differences between Power Query and Power Pivot are explained as follows:
|
Power Query |
Power Pivot |
|
Power Query is all about analyzing data. |
Power Pivot is all about getting and Transforming data. |
|
Power Query is an ETL service tool. |
Power Pivot is an in-memory data modeling component |
4. What is Power BI Desktop
Power BI Desktop is an open-source application designed and developed by Microsoft. Power BI Desktop will allow users to connect to, transform, and visualize your data with ease. Power BI Desktop lets users build visuals and collections of visuals that can be shared as reports with your colleagues or your clients in your organization.
5. What is Power Pivot?
Power Pivot is an add-on provided by Microsoft for Excel since 2010. Power Pivot was designed to extend the analytical capabilities and services of Microsoft Excel.
6. What is Power Query?
Power Query is a business intelligence tool designed by Microsoft for Excel. Power Query allows you to import data from various data sources and will enable you to clean, transform and reshape your data as per the requirements. Power Query allows you to write your query once and then run it with a simple refresh.
7. What is DAX?
DAX stands for Data Analysis Expressions. It's a collection of functions, operators, and constants used in formulas to calculate and return values. In other words, it helps you create new info from data you already have.
8. What are Filters in Power BI?
The term "Filter" is self-explanatory. Filters are mathematical and logical conditions applied to data to filter out essential information in rows and columns. The following are the variety of filters available in Power BI:
- Manual filters
- Auto filters
- Include/Exclude filters
- Drill-down filters
- Cross Drill filters
- Drillthrough filters
- Drillthrough filters
- URL filters–transient
- Pass-Through filters
9. What are Custom Visuals in Power BI?
Custom Visuals are like any other visualizations, generated using Power BI. The only difference is that it developes the custom visuals using a custom SDK. The languages like JQuery and JavaScript are used to create custom visuals in Power BI.
10. What is GetData in Power BI?
Get Data is a simple icon on Power BI used to import data from the source.