Overview Course - R Programming
You’ll learn programming in R, reading data into R, accessing R packages, writing R functions etc. View Course Curriculum
Price Match Guarantee
Full Lifetime Access
Access on any Device
Technical Support
Secure Checkout
Course Completion Certificate
 45% Started a new career
Enroll Now
-
 20% Got a pay increase and promotion
Students also bought -
-

- R Programming (basic to advanced)
- 20 Hours
- GBP 12
- 361 Learners
-

- R Programming
- 10 Hours
- GBP 12
- 1821 Learners
-

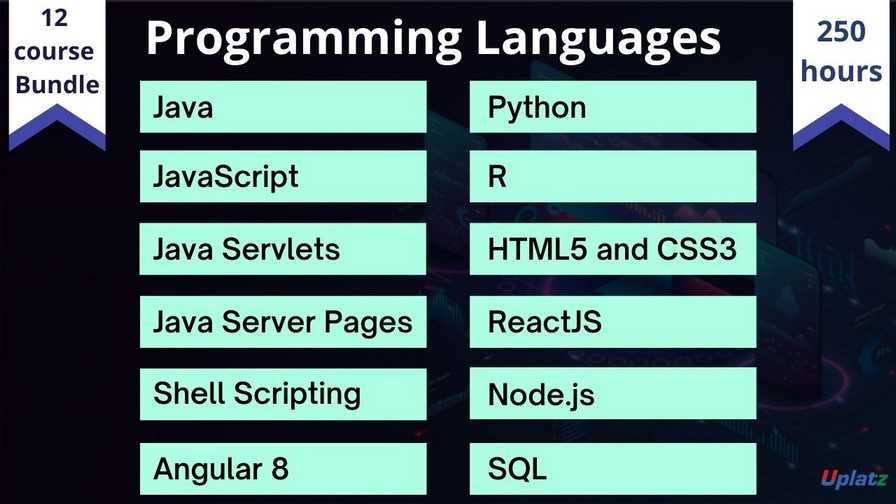
- Bundle Course - Programming Languages
- 250 Hours
- GBP 22
- 2454 Learners

This is an overview course on R Programming while the complete detailed-level R Programming course is available at - https://training.uplatz.com/online-it-course.php?id=r-programming-123. R is a programming language used commonly for scientific research, data analytics and statistical computing. Due to its simple and easy-to-use interface, R programming has gained immense popularity in recent years. Using R programming, data scientists can work with all sorts of retrieving, creating and manipulation of data.
Some of the advantages of using R programming over other programming languages include it being an open-source platform, it runs on all platforms like Windows, Mac, Linux etc., it is being used by some of the biggest tech giants and also learning R programming increases the chances of getting jobs for the students.
In this R Programming course at Uplatz, students will be learning about the R system, with the installation and configuration of R studio, R packages, R program structure, visualization data and preparing with R, R advanced features and many more.
After the successful completion of the course, students will be awarded a Course Completion Certificate on R programming from Uplatz.
Course/Topic - R Programming overview - all lectures
-
Introduction to R Programming
-
Setup of R Language
-
Variables and Data Types
-
Variables and Data Types
You will learn about;
•1) Introduction to R
•2) Installation to R
•3) Data Structures of R
•4) R Packages
•5) Condition Statements in R
•6) Sum Recursion
1. Understanding of R System
2. Installation and configuration of R-Environment and R-Studio
3. Understanding R Packages, their installation and management
4. Understanding of nuts and bolts of R:
a. R program Structure
b. R Data Type, Command Syntax and Control Structures
c. File Operations in R
5. Application of R Programming in Daily life problems
6. Preparing Data in R
a. Data Cleaning
b. Data imputation
c. Data conversion
7. Visualizing data using R with different type of graphs and charts
8. Applying R Advance features to solve complex problems and finetuning R Processes
The R Programming Certification ensures you know planning, production and measurement techniques needed to stand out from the competition.
R offers a wide variety of statistics-related libraries and provides a favorable environment for statistical computing and design. In addition, the R programming language gets used by many quantitative analysts as a programming tool since it's useful for data importing and cleaning.
Python is beginner-friendly, which can make it a faster language to learn than R. Depending on the problem you are looking to solve, R is better suited for data experimentation and exploration. Python is a better choice for large-scale applications and machine learning.
R and Python are both open-source programming languages with a large community. New libraries or tools are added continuously to their respective catalog. R is mainly used for statistical analysis while Python provides a more general approach to data science.
R programming is a relatively simple scripting language and learning to use R to get statistical packages is not hard. Also commonly used in data science, R has a simple syntax that is easy to learn. However, the R programming language has some inconsistencies, which can make learning hard.
Uplatz online training guarantees the participants to successfully go through the R Programming Certification provided by Uplatz. Uplatz provides appropriate teaching and expertise training to equip the participants for implementing the learnt concepts in an organization.
Course Completion Certificate will be awarded by Uplatz upon successful completion of the R Programming online course.
The R Programming draws an average salary of $140,000 per year depending on their knowledge and hands-on experience.
With good command over the R language, you can take various job roles such as data analyst, statisticians, and data scientist. As of today, these are the highly paid job roles in the market
R programmers are most in-demand, especially in emerging startups. Some of the positions that are available for the R programmers are as follows: Data Scientist. Business Analyst.
Note that salaries are generally higher at large companies rather than small ones. Your salary will also differ based on the market you work in.
Sr. Data Scientist.
R - Shiny Programmer.
Data Analytics
1) Explain what is R?
R is data analysis software which is used by analysts, quants, statisticians, data scientists and others.
2) List out some of the function that R provides?
The function that R provides are
- Mean
- Median
- Distribution
- Covariance
- Regression
- Non-linear
- Mixed Effects
- GLM
- GAM. etc.
3) Explain how you can start the R commander GUI?
Typing the command, ("Rcmdr") into the R console starts the R commander GUI.
4) In R how you can import Data?
You use R commander to import Data in R, and there are three ways through which you can enter data into it
- You can enter data directly via Data à New Data Set
- Import data from a plain text (ASCII) or other files (SPSS, Minitab, etc.)
- Read a data set either by typing the name of the data set or selecting the data set in the dialog box
5) Mention what does not ‘R’ language do?
- Though R programming can easily connects to DBMS is not a database
- R does not consist of any graphical user interface
- Though it connects to Excel/Microsoft Office easily, R language does not provide any spreadsheet view of data
6) Explain how R commands are written?
In R, anywhere in the program you have to preface the line of code with a #sign, for example
- # subtraction
- # division
- # note order of operations exists
7) How can you save your data in R?
To save data in R, there are many ways, but the easiest way of doing this is
Go to Data > Active Data Set > Export Active Data Set and a dialogue box will appear, when you click ok the dialogue box let you save your data in the usual way.
8) Mention how you can produce co-relations and covariances?
You can produce co-relations by the cor () function to produce co-relations and cov () function to produce covariances.
9) Explain what is t-tests in R?
In R, the t.test () function produces a variety of t-tests. T-test is the most common test in statistics and used to determine whether the means of two groups are equal to each other.
10) Explain what is With () and By () function in R is used for?
- With() function is similar to DATA in SAS, it apply an expression to a dataset.
- BY() function applies a function to each level of factors. It is similar to BY processing in SAS.
11) What are the data structures in R that is used to perform statistical analyses and create graphs?
R has data structures like:
- Vectors
- Matrices
- Arrays
- Data frames
12) Explain general format of Matrices in R?
General format is
Mymatrix< - matrix (vector, nrow=r , ncol=c , byrow=FALSE,
dimnames = list ( char_vector_ rowname, char_vector_colnames))
13) In R how missing values are represented ?
In R missing values are represented by NA (Not Available), why impossible values are represented by the symbol NaN (not a number).
14) Explain what is transpose?
For re-shaping data before, analysis R provides various method and transpose are the simplest method of reshaping a dataset. To transpose a matrix or a data frame t () function is used.
15) Explain how data is aggregated in R?
By collapsing data in R by using one or more BY variables, it becomes easy. When using the aggregate() function the BY variable should be in the list.
16) What is the function used for adding datasets in R?
rbind function can be used to join two data frames (datasets). The two data frames must have the same variables, but they do not have to be in the same order.
17) What is the use of subset() function and sample() function in R?
In R, subset() functions help you to select variables and observations while through sample() function you can choose a random sample of size n from a dataset.
18) Explain how you can create a table in R without external file?
Use the code
myTable = data.frame()
edit(myTable)
This code will open an excel like spreadsheet where you can easily enter your data.


