Dynatrace
Learn Full-Stack Monitoring, Application Performance Monitoring, End-to-end Observability, and AIOps with Dynatrace for Proactive IT Operations.Preview Dynatrace course
Price Match Guarantee Full Lifetime Access Access on any Device Technical Support Secure Checkout Course Completion Certificate 91% Started a new career
BUY THIS COURSE (GBP 29)
-
 81% Got a pay increase and promotion
Students also bought -
-
- Alteryx
- 10 Hours
- GBP 29
- 10 Learners
-
- Splunk for Real-World Scenarios: From Logs to Insights
- 10 Hours
- GBP 29
- 10 Learners
-
- Tableau (comprehensive)
- 20 Hours
- GBP 29
- 372 Learners
Dynatrace: Master Intelligent Observability & Monitoring Automation – Self-Paced Online Course
In today’s rapidly evolving IT landscape, businesses demand uninterrupted digital experiences, faster deployment cycles, and robust performance visibility. Dynatrace has emerged as a leading solution for full-stack monitoring, application performance management, and AI-driven automation, offering a unified platform that goes beyond traditional monitoring tools. This self-paced online course is designed to equip professionals with the practical skills and strategic understanding needed to harness the full capabilities of Dynatrace, whether you’re an IT administrator, DevOps engineer, SRE, or cloud architect.
The course begins with a thorough introduction to the Dynatrace platform, where learners gain familiarity with its core architecture, including Smartscape topology, Davis AI engine, and the deployment of OneAgent across various environments—on-premises, cloud, hybrid, and containers. You’ll learn how to seamlessly deploy OneAgent on servers, virtual machines, and Kubernetes clusters, unlocking deep visibility into infrastructure health, application performance, and user behavior without manual configuration.
From there, the course dives into real user monitoring (RUM), synthetic monitoring, and distributed tracing to provide a 360-degree view of how applications are experienced by end users and how transactions flow across systems. These capabilities enable proactive detection of performance bottlenecks and pinpointing of root causes with minimal manual intervention, thanks to the Davis AI engine, which automatically correlates anomalies and identifies affected entities.
One of the course’s highlights is its focus on advanced observability and automation. You’ll learn how to configure custom alerts, define Service-Level Objectives (SLOs), and build performance dashboards tailored to key metrics and business KPIs. Through hands-on labs, you’ll practice setting up automated incident workflows, integrating Dynatrace with external tools like ServiceNow, Slack, PagerDuty, Jenkins, and Prometheus. This empowers you to respond to anomalies faster and embed observability into your DevOps and CI/CD pipelines for seamless application lifecycle management.
The course also covers cloud-native monitoring in depth, teaching you how to monitor microservices, containerized applications, and serverless functions across platforms such as AWS, Azure, and Google Cloud. Dynatrace’s capabilities in auto-discovery and contextual analysis make it ideal for today’s dynamic environments, and learners will explore Kubernetes monitoring, including pod health, resource utilization, and service interdependencies via Smartscape and Grail.
Security and compliance are increasingly important, and this course introduces Dynatrace’s Application Security module, which provides real-time vulnerability detection across the software stack. You’ll understand how to identify and prioritize risks in your code, libraries, and third-party dependencies without affecting performance, helping your organization stay secure while accelerating delivery.
By the end of the course, you will be able to confidently deploy, configure, and operate Dynatrace in enterprise environments, utilizing its automation and analytics capabilities to proactively manage digital services. You’ll gain a deep understanding of how to translate observability data into meaningful action—whether it's optimizing application performance, improving user experience, or ensuring uptime for mission-critical systems.
Learners will benefit from real-world case studies, guided exercises, and downloadable labs that simulate actual enterprise challenges, reinforcing your skills through practical scenarios. Additionally, the course includes tips and strategies for passing Dynatrace Associate and Professional certification exams, helping you formally validate your expertise.
What sets this course apart is its hands-on focus, intuitive progression from beginner to advanced topics, and relevance across multiple job roles—from SREs and cloud engineers to performance analysts and consultants. Whether you're looking to modernize IT operations, scale observability across the organization, or automate cloud monitoring, this course gives you the tools and insights to lead with confidence in a digital-first world.
With lifetime access to all course materials, downloadable resources, and expert support, this learning experience is crafted to meet the evolving needs of today’s tech professionals. As the demand for unified observability and proactive IT management continues to grow, Dynatrace expertise is becoming a vital differentiator in the job market, and this course is your gateway to mastering it.
Course/Topic 1 - Coming Soon
-
The videos for this course are being recorded freshly and should be available in a few days. Please contact info@uplatz.com to know the exact date of the release of this course.
This course is designed to provide learners with a comprehensive understanding of the Dynatrace platform, equipping them with the skills needed to monitor, analyze, and optimize modern IT environments using intelligent automation and full-stack observability.
By the end of this course, learners will be able to:
-
Understand Dynatrace architecture and core components, including OneAgent, Smartscape, and the Davis AI engine.
-
Deploy Dynatrace OneAgent across physical, virtual, cloud, and containerized environments for seamless monitoring.
-
Monitor applications, infrastructure, and services with deep visibility into processes, network traffic, logs, and user behavior.
-
Leverage Real User Monitoring (RUM) and Synthetic Monitoring to analyze performance from the end-user perspective.
-
Use distributed tracing and service flow analysis to identify performance bottlenecks and trace transaction paths across systems.
-
Automate root cause analysis and incident resolution using AI-powered insights provided by Davis.
-
Create custom dashboards, metrics, and alerting rules to visualize and act on critical system data.
These objectives ensure learners gain both technical proficiency and strategic insight to maximize Dynatrace’s capabilities in real-world IT operations.
Dynatrace – Course Syllabus
1. Introduction to Dynatrace
-
What is Dynatrace and its core capabilities
-
Dynatrace architecture: OneAgent, ActiveGate, and Dynatrace platform
-
Comparison with other APM tools (Datadog, New Relic, etc.)
-
Use cases: Cloud observability, DevOps, Business analytics, Security
-
Account setup and environment configuration
2. Installing and Configuring Dynatrace
-
Deploying OneAgent on hosts (Linux, Windows, Kubernetes)
-
Network zones and ActiveGate configuration
-
Monitoring containers and orchestrators (Docker, Kubernetes, OpenShift)
-
Tagging, naming rules, and management zones
-
API and CLI basics for configuration automation
3. Application Performance Monitoring (APM)
-
Real-time distributed tracing and PurePath analysis
-
Services, requests, and backtrace of slow transactions
-
Code-level visibility for Java, .NET, Node.js, and other languages
-
Detecting service bottlenecks, error hotspots, and latency issues
-
Custom service instrumentation and user actions
4. Infrastructure & Cloud Monitoring
-
Host and process monitoring
-
Monitoring cloud environments: AWS, Azure, GCP
-
Infrastructure overview dashboards
-
Smartscape topology and dependency mapping
-
Container and pod-level visibility in Kubernetes
5. Real User Monitoring (RUM) & Synthetic Monitoring
-
Setting up RUM for web and mobile apps
-
Analyzing user sessions and user behavior
-
Session Replay and performance breakdown
-
Synthetic monitors (browser/API checks)
-
Multi-location tests and alerting
6. Logs, Metrics, and Events
-
Enabling log monitoring and log analytics
-
Metrics ingestion: custom, external, Prometheus-based
-
Metric expressions and transformations
-
Smart Alerts, thresholds, and anomaly detection
-
Event correlation and root cause analysis
7. Dashboards, Reports & Business Insights
-
Building custom dashboards with tiles and filters
-
Business KPI monitoring with user-defined metrics
-
Dashboards for infrastructure, applications, and teams
-
Custom reports and scheduled exports
-
Tag-based and role-based data presentation
8. AI-Powered Problem Detection (Davis AI)
-
Davis AI engine fundamentals
-
Automatic problem detection and impact analysis
-
Anomaly detection for services, infrastructure, and availability
-
Causation vs. correlation and AI-assisted resolution
-
Davis Assistant and chat-based alerts
9. Integration & Automation
-
CI/CD toolchain integration: Jenkins, GitLab, Azure DevOps
-
Infrastructure as Code (IaC) with Terraform for Dynatrace resources
-
ServiceNow, Slack, Jira, Opsgenie, and PagerDuty integration
-
OpenTelemetry and Dynatrace Extensions 2.0
-
Custom plugins and API-driven automation
10. Real-World Projects & Certification Preparation
-
End-to-end monitoring setup for a cloud-native application
-
Performance tuning and anomaly detection hands-on
-
Simulated outages and incident response using Dynatrace
-
Sample use cases: SLA tracking, release validation, cloud migration monitoring
-
Preparing for Dynatrace Associate / Professional Certification
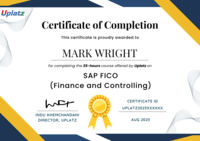
Upon successfully completing the Dynatrace online course, learners will receive a Certificate of Completion issued by Uplatz, formally recognizing their expertise in using Dynatrace for full-stack observability, performance monitoring, and intelligent automation. This certificate validates your ability to deploy and configure Dynatrace OneAgent, monitor applications and infrastructure, utilize AI-powered root cause analysis with Davis, and integrate Dynatrace with DevOps and cloud-native environments.
The certificate serves as a tangible proof of your proficiency in applying Dynatrace to solve real-world IT and operational challenges, including synthetic and real user monitoring, service-level tracking, and security vulnerability detection. It enhances your professional credibility, boosts your resume, and signals to employers that you have both theoretical knowledge and practical experience with one of the industry’s most advanced observability platforms.
Dynatrace skills are in high demand across industries focused on digital performance and customer experience. Job roles include:
-
Site Reliability Engineer (SRE)
-
DevOps Engineer
-
Cloud Monitoring Specialist
-
Performance Engineer
-
Application Support Analyst
-
Observability Consultant
-
Infrastructure Monitoring Engineer
Organizations using Dynatrace span sectors like finance, e-commerce, telecom, and SaaS—where real-time visibility and intelligent automation are mission-critical.
-
What is Dynatrace?
Dynatrace is an AI-powered observability platform for monitoring infrastructure, applications, logs, user experience, and cloud environments. -
How does OneAgent work?
OneAgent automatically collects metrics, traces, logs, and events from the host and applications, enabling deep observability with minimal manual configuration. -
What is Smartscape?
Smartscape is Dynatrace’s real-time topology mapping engine, showing dependencies among hosts, services, processes, and applications. -
How does Davis AI help?
Davis is Dynatrace’s AI engine that provides automated anomaly detection, root-cause analysis, and actionable insights. -
Difference between RUM and Synthetic Monitoring?
RUM tracks real user interactions in real-time, while Synthetic Monitoring uses scripted transactions to simulate user behavior. -
What are SLOs in Dynatrace?
Service Level Objectives define acceptable service levels (like latency or availability) and help track performance against these goals. -
Can Dynatrace monitor cloud-native apps?
Yes, Dynatrace offers deep observability into Kubernetes, containers, serverless, and microservices environments. -
Which third-party tools integrate with Dynatrace?
Popular integrations include ServiceNow, Slack, PagerDuty, Prometheus, Ansible, and Jenkins. -
How is Dynatrace different from other monitoring tools?
Dynatrace offers automatic full-stack instrumentation, AI-powered insights, and a unified platform for DevOps, business, and security stakeholders. -
What is the Dynatrace Hub?
It’s a marketplace of extensions, integrations, and custom monitoring configurations that extend Dynatrace functionality.


